

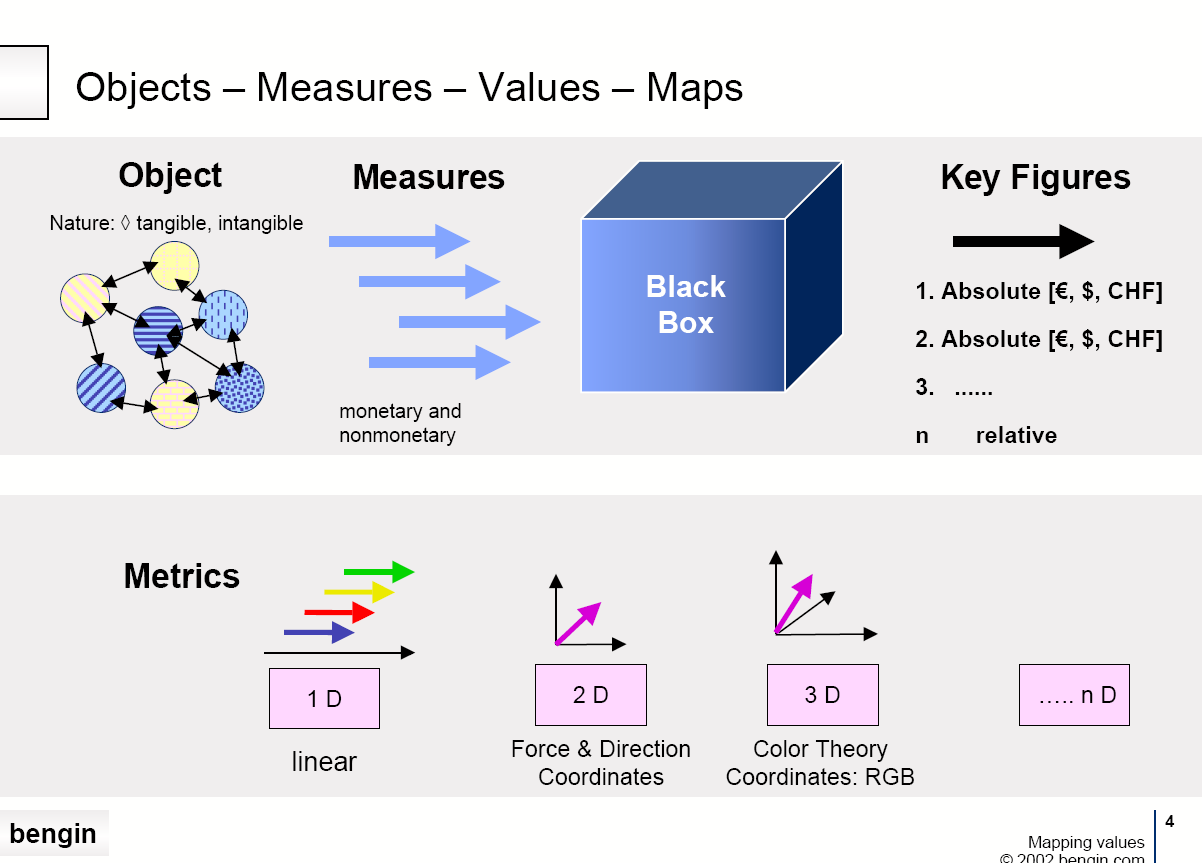
Vector shows Values - monetary and non-monetary
Sometimes it is not possible to measure a value in monetary units only.
Elements (clusters) may have subjective priorities (values) too. And in a decision process that subjective dimension should have it's impact too. The vector - for example - visualizes investments combined with individual priorities.
Vector even allows to combine two monetary indicators. As for example profit and expenses for different business units. The vector profile over several units shows the performance of each compared with others and relative to the total performance in one picture.
Other applications are for comparing investment, turnover, profit, cost, contribution margin... with headcount, storage area, and so on....
Another application for the vector is the visualization and calculation of economic potential, which is created through investment.
The Vector principle allows the first time in the history of economic theory to quantify the hidden economic potential in order to make broader and professional use of this intangible assets.
This step is similar to the discovery and introduction of the energy in physics.
After we understood the nature of energy, we were able to work with it... (Historical citation from physics.)

Special page for free Excel Vector templates
If you have an Excel license there's no need to buy some additional software.
Just download one of the templates that fits best your needs from our (beta) download page - or as many of them as you want. And try it yourself.
We did not implement any macro or spyware that sends informations about usage of this templates.
There are no special tricks in the Excel code so you can easily change the matrix and visualization depending on your needs.
The Vector principle and visualization is copyrighted. Private use and professional trials needs no license and no registration. However, if you'd like to make derivative works or use it in professional, commercial environment you are asked to contact us for a license solution.

Vector Profile Eurozone, US & Japan
(GDP and Foreign debt)
Wondering why EU punished Greece?
download pdfdownload xlsx

Vector Profile Global Wealth
Number of people (in Million) that control US$ (in Trillion).
download pdfdownload xlsx

Motivation and Performance
Combines motivation and performance of four marketing organizations.
One profile shows the indicators before and the other after management has taken some actions.
Easy to recognize the different results in this four organizational units.
download xlsx

State of Global Workplace
Combines active engagement and disengagement of Workplace on a Country level.
From left to the right:
India, China, Germany, Switzerland, Austria, USA, Australia, United Kingdom, Croatia, Costa Rica.
The more inclined, the more disengaged.
download xlsx


Introducing principle of Subjective Use Value
Any valuation is based on subjective and objective criteria. To buy something is the result of an individual valuation process.
To buy a share is based on the expectation that the price of the paper would rise.
Introducing a second axis for subjective (implicit, virtual) values, combined with a specific metric (i$), allows to determine the individual SPE (Shareholders Profit Expectation, the blue vector) for any traded object.
download xlsx

Twitter and the Shareholders Profit Expectation
At IPO time the SPE is 970.000 i$.
More information is planned to released autumn 2014.
download xlsx
Expanding Value Paradigm (SwissRe)
Peer to peer discussion
This peer discussion addressed the latest thinking on the importance of intangible values as well as resulting risks and opportunities. Participants were able to share experiences gained and hear best practices in the managing, auditing and reporting of intangible assets. Additionally, actions to introduce a new generation of value measurement and value management were considered.
There's a special page for downloading all papers of this event - even from the other participants.
download pdf download ppt goto special page
Linking the Subjective and Objective Dimension into One System of "Vector-Based" Performance Measurement.
Abstract:
Customers or other stakeholders require from business or non-profit organizations today to act according to their subjective, qualitative values. Therefore organizations have to take increasingly qualitative, subjective ratings and values into account in managerial decision making. Thus, they need performance measurement systems that are able to handle subjective, qualitative measures and to combine them with objective, financial information. The vector-based concept of performance measurement & visualization that is introduced in this paper and that the authors discuss is offering a practical solution for this.
You may download describing Paper and/or Powerpoint presentation.
download pdf download ppt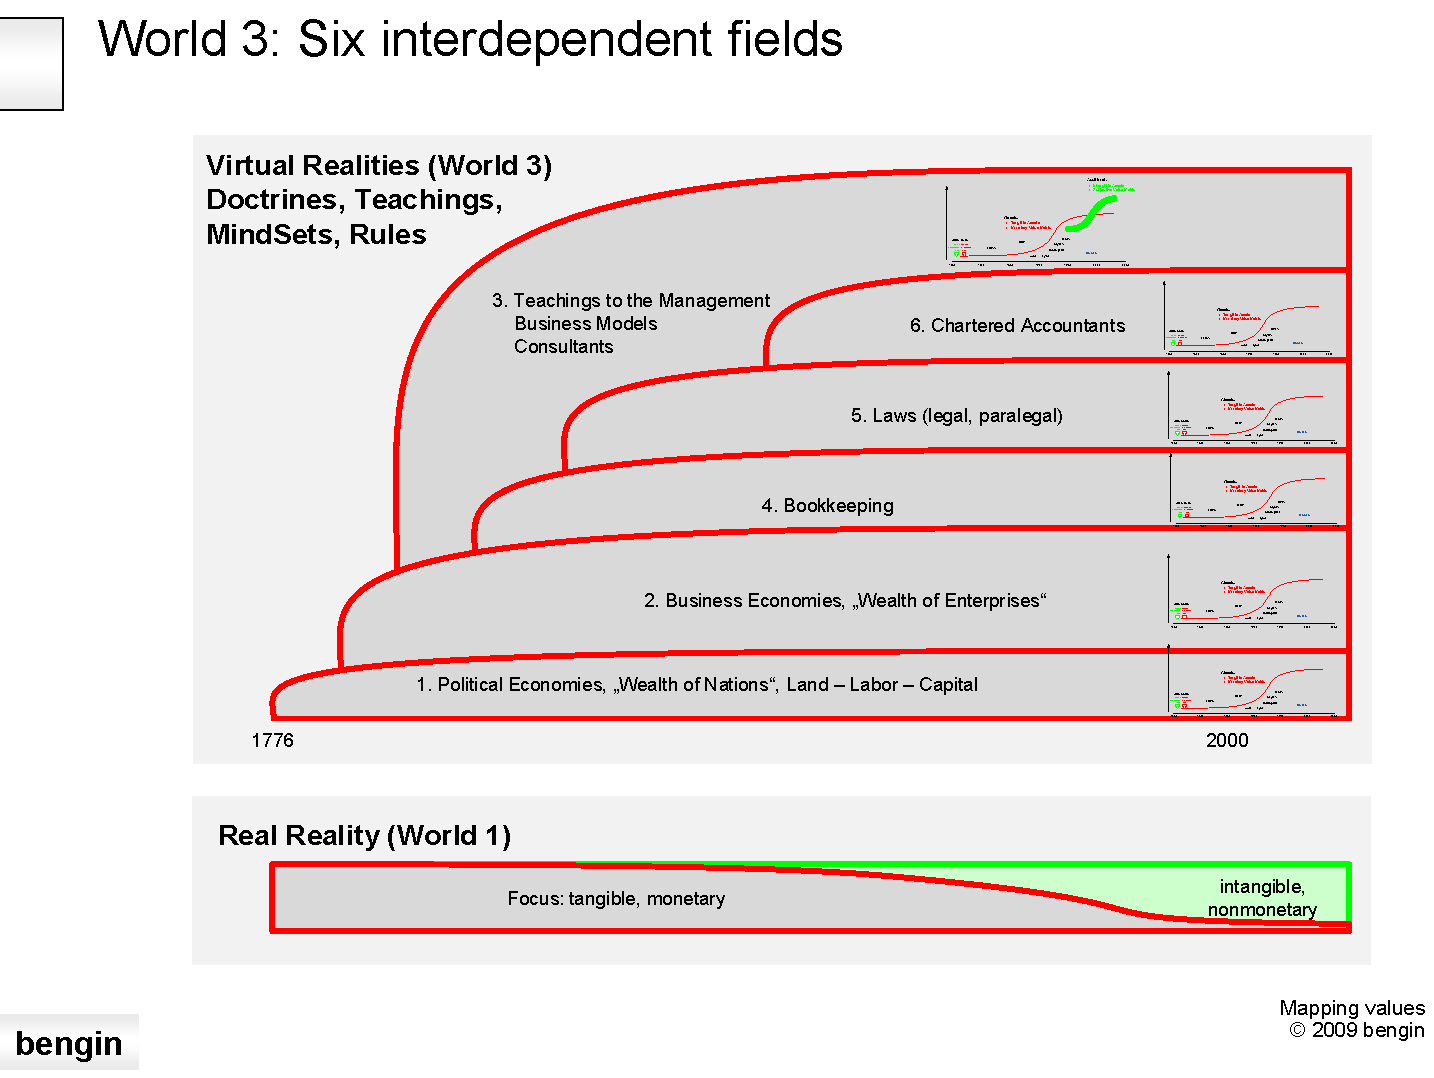
Advanced tools for Visualizing, Measuring and Managing Intangibles (Dresden 2009)
Introduction and problem description
In the last years it showed up that the instruments of the economists do not have the desired precision. The author would like to point out possibilities with this paper, how with new aspects and instruments white fields of the economic map can be mapped and new business options become possible.
You may download describing Paper and/or Powerpoint presentation.
download pdf download ppt
Thoughts for a complementary view to the Classic Economic Mindset
Agenda
- Practical need for model that integrates intangibles
- Findings and Project
- Three Levels of Enterprise
- Values, Visuals & Framework beyond Adam Smith & Co
- Links
You may download Powerpoint and pdf file.

Strategic Economic Potential and Performance Quadrants (explicit meets implicit)
Classic view is, that you measure and show value, progress and performance in monetary units. This economic paradigm lefts out that there are nonmonetary values too.
If one accepts the potential as second dimension it's possible to show the four quadrants of integrated enterprise wealth.
- Build potential (invest money, gain knowledge/intangibles...)
- Grow (sell goods, services, licenses, earn additional knowledge/intangibles)
- Reduce (sell part of potential, infrastructure..., earn money)
- kill (shed, lose potential and money)
You may download Powerpoint and pdf file that was made for video.
download pdf download pptxAbout
"Business Engineering Systems" is a set of "think-how" the problems and tasks from another point of view.
This additional perspective gives new dimensions for creating better solutions and enables new freedom for the sustainable development of economy, politics and society that has not been possible in the classic mindset.
"Business Engineering Systems" is
part of "Project NEMO" (New/Next Economic Model) and "INSEDE" (Institute for Sustainable Economic Development)
Newsletter
Coming soon.
Recent Blog Entries


Contact Us
Alpsteinstrasse 4, 9034 Eggersriet
Switzerland
Mobile: +41 79 650 49 04
Fixnet: +41 71 877 14 11
Email: peter.bretscher@bengin.com
IBAN: CH1809000000900180483
Stay Connected
2016/20 © Peter Bretscher. ALL Rights Reserved. Privacy Policy | Terms of Service