1934: GDP (Simon Kuznets) and Creative Destruction (Joseph Schumpeter)
1934 Simon Kuznets proposed GDP to the US Congress. A measure for measuring the progress of nation. He called it Gross Domestic Product (GDP).
1934 another event took place. Joseph Schumpeter thought about economic progress and came to the conclusion, that all progress has one common base: Creative Destruction (of old thoughts and solutions).
Looking at the GDP as an artificial product of mind restricting the progress to be measured in $-Units - and knowing, that intangibles and non-$-Measures are driving more and more the wealth of enterprises and nations - it is somehow logic that non-$-Indicators should also been taken into the decision making. If one intends to make sustainable decisions.
And here it is.
The Social Progress Imperative. A Framework and Indicator System that deals only with metrics that impacts what nature and people matters.
Because GDP-programmed thinkers may be somehow lost in a new framework we propose a combination of GDP and SPI Value metric - a Social and Economic Value Profile.
Take the indicators, put them into the interactive Excel below of this page and see and compare the 2D-Progress of several nations.
See more about:
Gross Domestic Product (Wikipedia)Creative Destruction (Wikipedia)
GDP as a "product of mind" has reached top of s-curve.
Measuring in $-Units is no longer enough.
Further progress is possible only with a new approach.
Social progress indicators are needed too.

From GDP to Social Progress Imperative
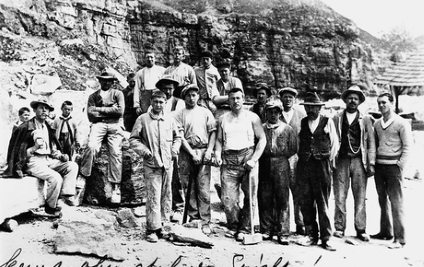
1930: Manual Workmen
The results of their work could have been seen - and touched were tangible. Had weight and could be counted in numbers.
$-Metric as a proxy in 1934
for measuring economic progress in the form of Gross Domestic Product and wealth of nations..
Go to the Social Progress Imperative in a new window here.
Beyond $-Metric
Not all progress and valuable assets are measurable in $-Units. Additional framework and measures are needed.
Go to the Social Progress Imperative in a new window here.
Take the Social Progress Index
Look for SPI of Country
for measuring economic progress beyond Gross Domestic Product and wealth of nations..

Open the Social Progress Imperative in a new window here.
Combine SPI with GDP
Put your data in an Excel sheet see the 2D-Value-Progress Profile. Colours as provided from SPI.
You may download your own Excel-Template here. No E-mail, no name needed.

Want more and other Excel-Vector-Templates?
Click on image below.

See how Vector Profile works (here with "traffic lights")
Change the chart of indicators and nations below.
It's an interactive Excel sheet. (Web-)Page refresh sets back to original indicators.
Want your own Excel-Template? Download here. No E-mail, no name needed.
Find more and other templates here.
Want to know about Hybrid Reporting? Go here
This visualization is part of "Project NEMO" (New/Next Economic Model). It's a system of economic frameworks and metrics to design an economy as if nature and people (potential and needs) matters.
We would be happy if you'd join us and go to "Project NEMO".

This work is licensed under a Creative Commons Attribution-NonCommercial-ShareAlike 4.0 International License.


