Metrics are artificial, man-made standards for comparing a property of an object (tangible or intangible) or of a process.
There are subjective and objective metrics. And there are qualitative (in signs) and quantitative (in numbers) metrics.
Objective metrics are based on a standard that has been agreed upon. To this standard belongs a defined "unit" [meters, seconds, watts...]
Subjective metric are based on subjective standards - such standards are based on criteria set by individuals [nice, thick, good, cheap...]. Unlike "objective metrics", these standards can change very quickly depending on the situation.
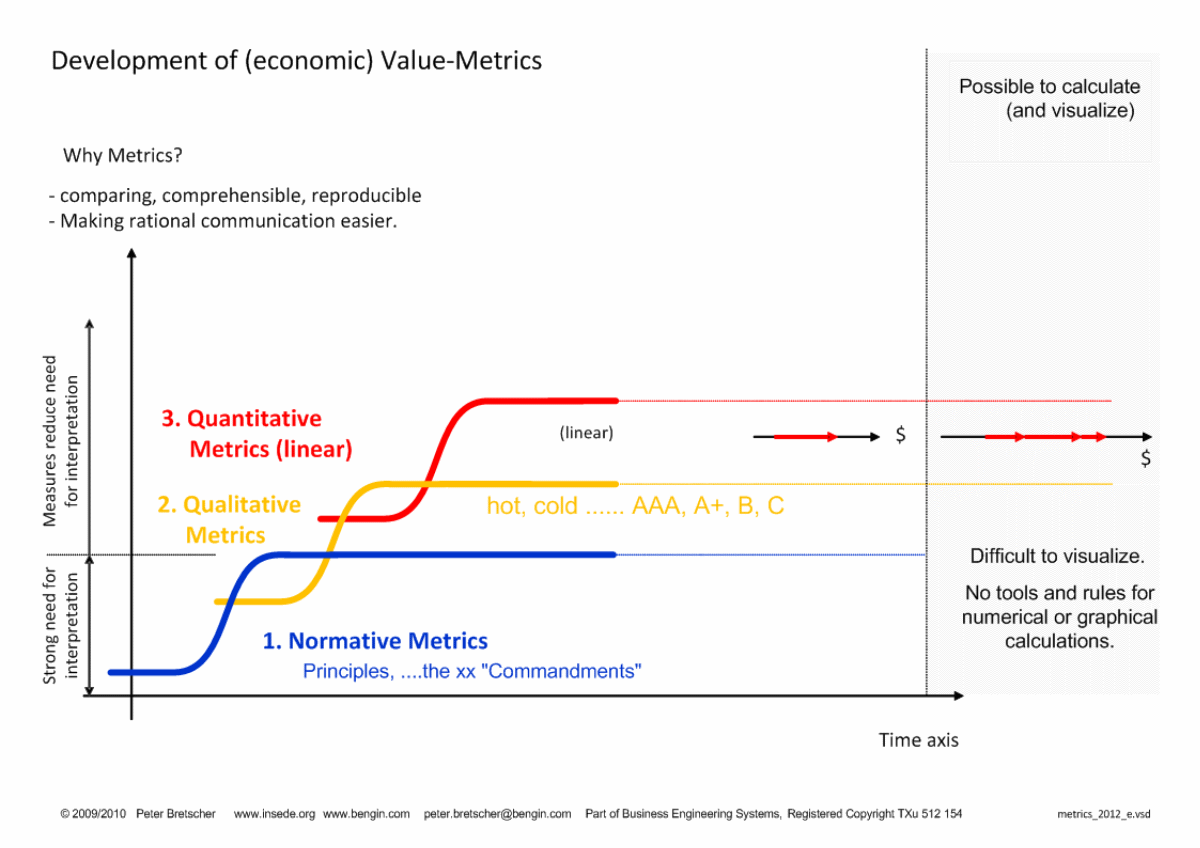
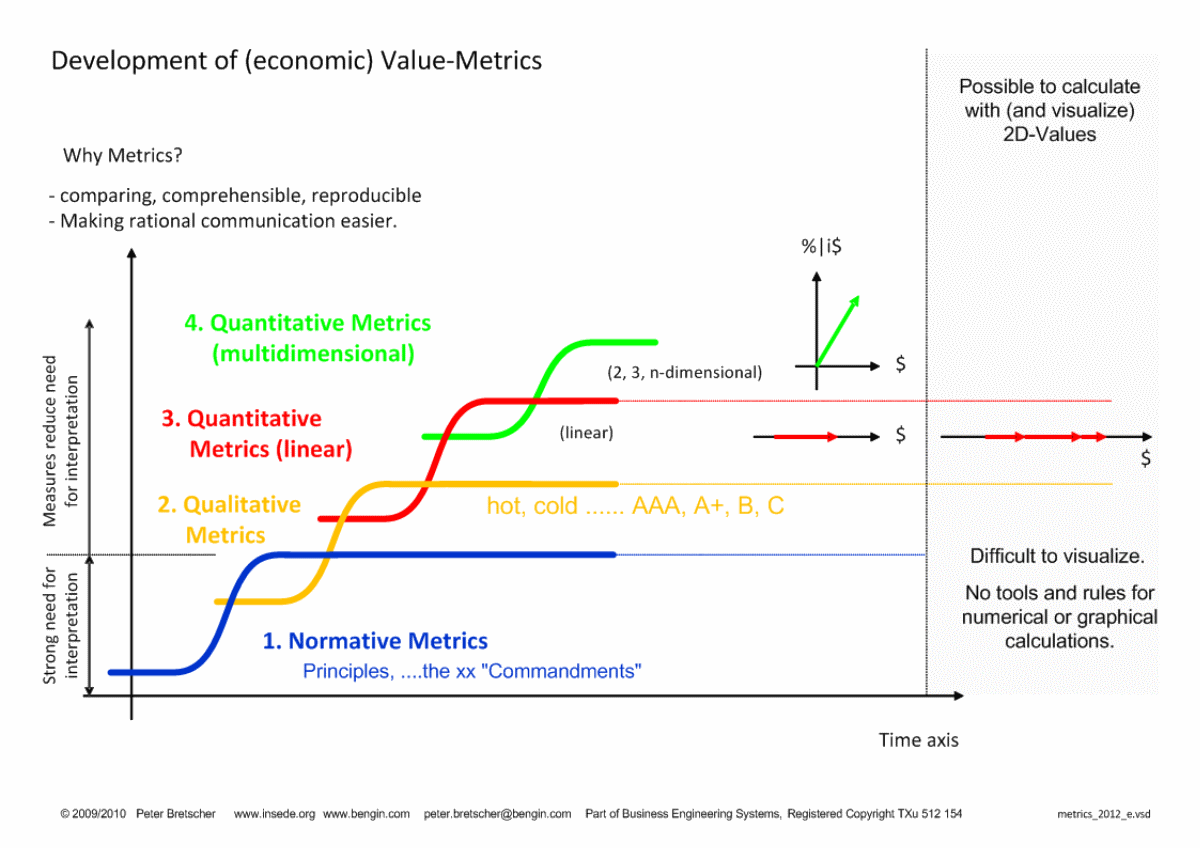
Over time, four different types of metrics have developed and are used in parallel. The "normative", the "qualitative", the linear quantitative and the multidimensional quantitative metrics.
Economic values" are also determined by people according to their subjective value preferences. Without people there are no values, only (objective) prices [$] and costs [$]. Real values are made up of subjective (implicit, non-monetary) and objective (explicit, monetary) criteria.
These two different characteristics can be calculated and represented well in the form of vectors.
In addition, vector representation is suitable for any combination of objective and subjective metrics and as well as several clusters. The relationships of the indicators to each other, which can only be deduced directly from the figures by experienced specialists, are shown in the vector representation on one image. This facilitates decision making enormously.
Link for downloading video as as PDF
- Metrics are artificial men made objects.
- Metrics had and have to be invented (were not thrown from heaven).
- Metrics have a unit.
- Objective metrics are standardized.
- Measuring = comparing relative to standard.
"Count what is countable, measure what is measurable and what is not measurable, make measurable!"
Galileo Galilei, 15.02.1564 - 08.01.1642


