Want to show the relationship of several clusters with any two indicators?
(Indicators may be monetary, non-monetary, objective and or subjective)
Then: This is the solution, kpisquare and Vektor Profiles.
- On this page you will find different free templates for Excel vector profiles for download.
- Click on the picture shows the large version and click on the buttons either downloads the Adobe Acrobat (pdf) or the Excel file(xlsx).
- The templates are unprotected and free from macros/VBA.
- You may use it free for your personal and noncommercial use. See Creative Commons License below.
Tips and tricks:
- look for the template, which contains at least that number of clusters that you want to consider.
(Not required clusters may be set to zero. The index may be revised direct in the chart.) - Use for comparison of data sets - for example, budget and account of two companies or business cycles or.... - the pure vector representation (without colorized rectangles).
Use it for comparing monetary with monetary - monetary with nonmonetary and nonmonetary with nonmonetary indicators. You may be surprised about the new transparency you will gain. - Make "Drill-Downs" by copying the first page behind that page so much times as you have "clusters".
Then structure the elements of the "sub-clusters" according to your needs and link the sum to the corresponding field on the first page. - Connect in the Excel your internal data with external data from web.
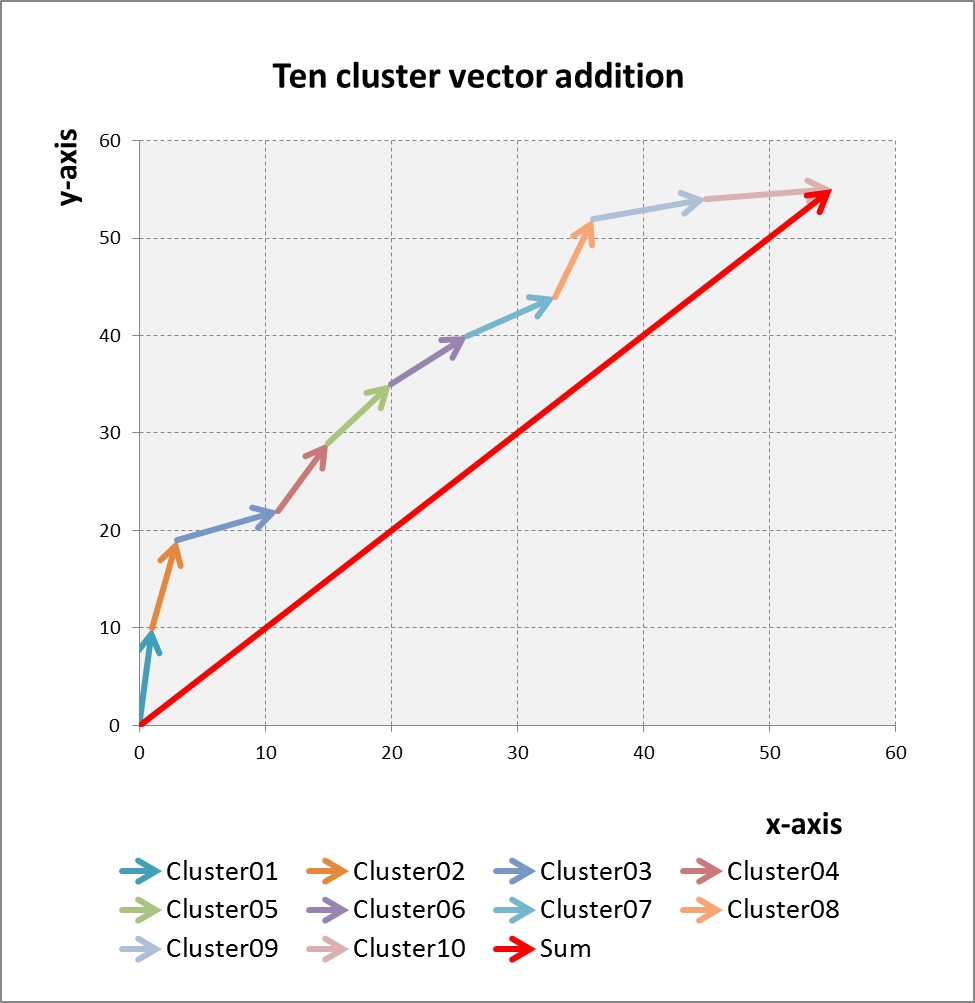
10 Simple Vectors
Comparison of 10 clusters - for example, divisions, countries, projects, cost centers..... - among themselves and within the overall context.
Download pdf Download xlsx
10 Vectors with Frames
Frames around the vectors facilitate untrained observer the orientation.

Similar to "10 Simple Vectors" but with a second record.
This allows the simultaneously displaying budget and result - for two time periods, markets, business units or......
Download pdf Download xlsx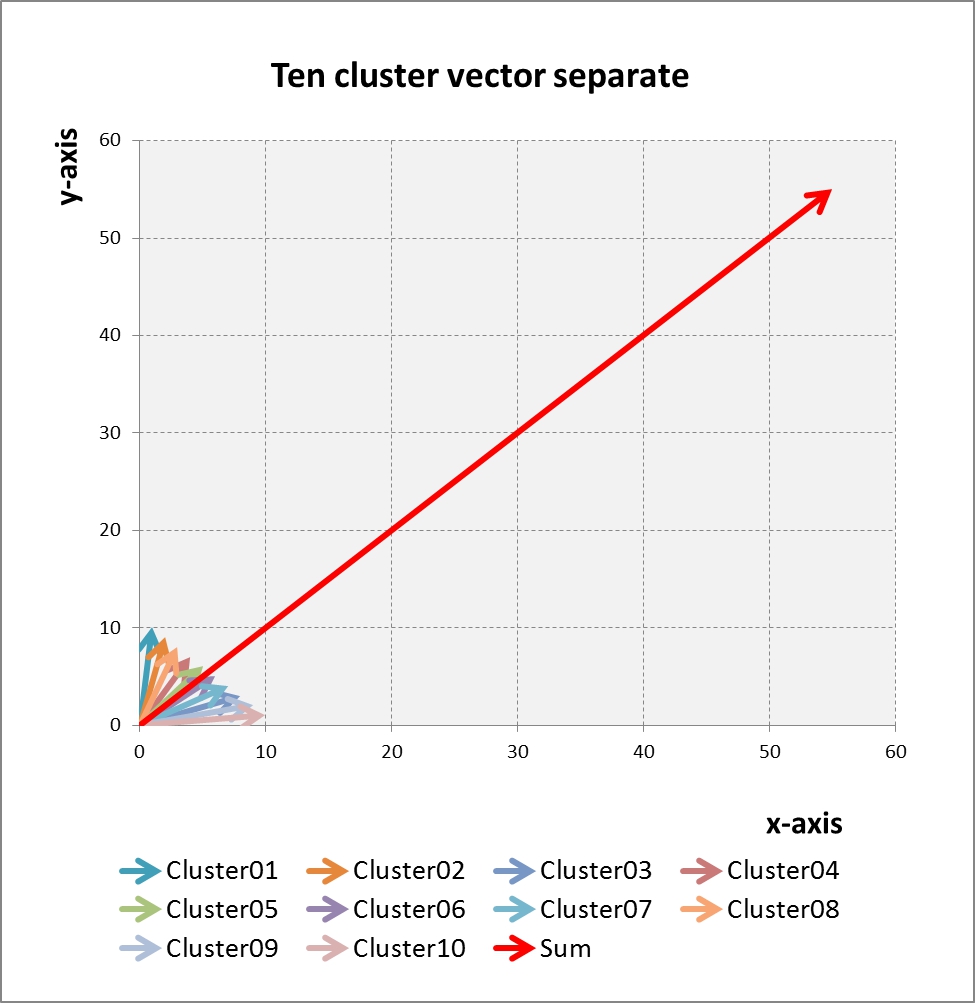
10 Vectors (not added)
10 cluster starting x=0 and y=0 (without addition) with sumvector.
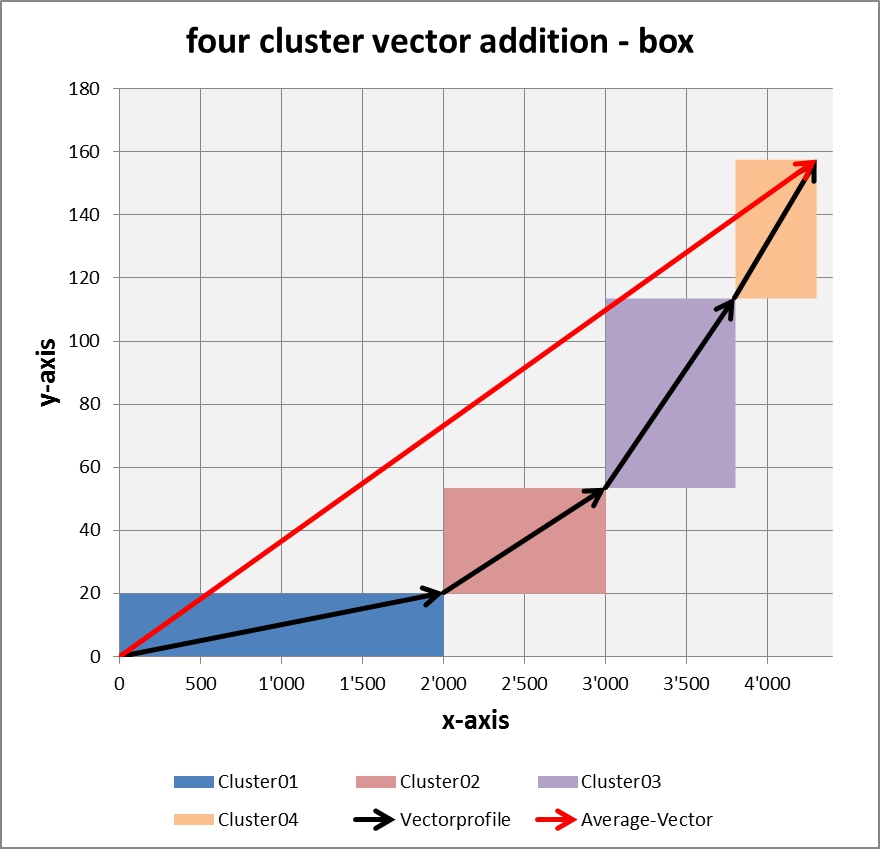
4 Vectors in Box
4 clusters and vectors with underlying colored background.
Easier for newbies to see the interdependences.
Restriction: Values on x-axis must not be negative.

10 Vectors in Box
Similar to "10 Simple Vectors" - 10 clusters and vectors with underlying colored background.
Easier for newbies to see the interdependences.
Restriction: Values on x-axis must not be negative.

Ortscurve / Valuetrack
Connects several 2d-Milestones - for example, nine years track of milestones in an enterprise, a business unit.....
Download pdf Download xlsx
3 Ortskurves / Valuetracks
Example for tracking 3 Enterprises.... or customers... or competitors... or three periods... or.....
Download pdf Download xlsx
Similar to "10 Vectors in Box" above
The y-values of the clusters have three parameters. Enabling for example visualizing expenses for marketing, R&D and production in the 10 clusters.

Real Value determination
This visualization discloses the solution to establish a quantitative solution for an objective use value.
The basics of the formula follows the principle of pythagoras.
Legal notes:
Pictures are proprietary and part of "Business Engineering Systems" (Registered Copyright TXu512154).
Private use is permitted without license - derivative works and commercial use requires registered license (enduser, consultant, education, software...). See Creative Commons.
This work is licensed under a Creative Commons Attribution-NonCommercial-NoDerivatives 4.0 International License.
Contact us for additional information.
About
"Business Engineering Systems" is a set of "think-how" the problems and tasks from another point of view.
This additional perspective gives new dimensions for creating better solutions and enables new freedom for the sustainable development of economy, politics and society that has not been possible in the classic mindset.
"Business Engineering Systems" is
part of "Project NEMO" (New/Next Economic Model) and "INSEDE" (Institute for Sustainable Economic Development)
Newsletter
Coming soon.
Recent Blog Entries
-
Website of Business Engineering Systems in permanent update

-
Better design new tool for the workpiece than using an inadequate tool.

-
Ever tried to fix a screw with a hammer? Why then are you trying to run an intelligent enterprise with old economic instruments and indicators?
Time to take the consequences and alternatives.
Contact Us
Alpsteinstrasse 4, 9034 Eggersriet
Switzerland
Mobile: +41 79 650 49 04
Fixnet: +41 71 877 14 11
Email: peter.bretscher@bengin.com
IBAN: CH1809000000900180483
Stay Connected
2017/20 © Peter Bretscher. ALL Rights Reserved. Privacy Policy | Terms of Service