There is a lot of misunderstanding when one talks about value. Some think about numbers, others about money, others about cars, houses and so on.
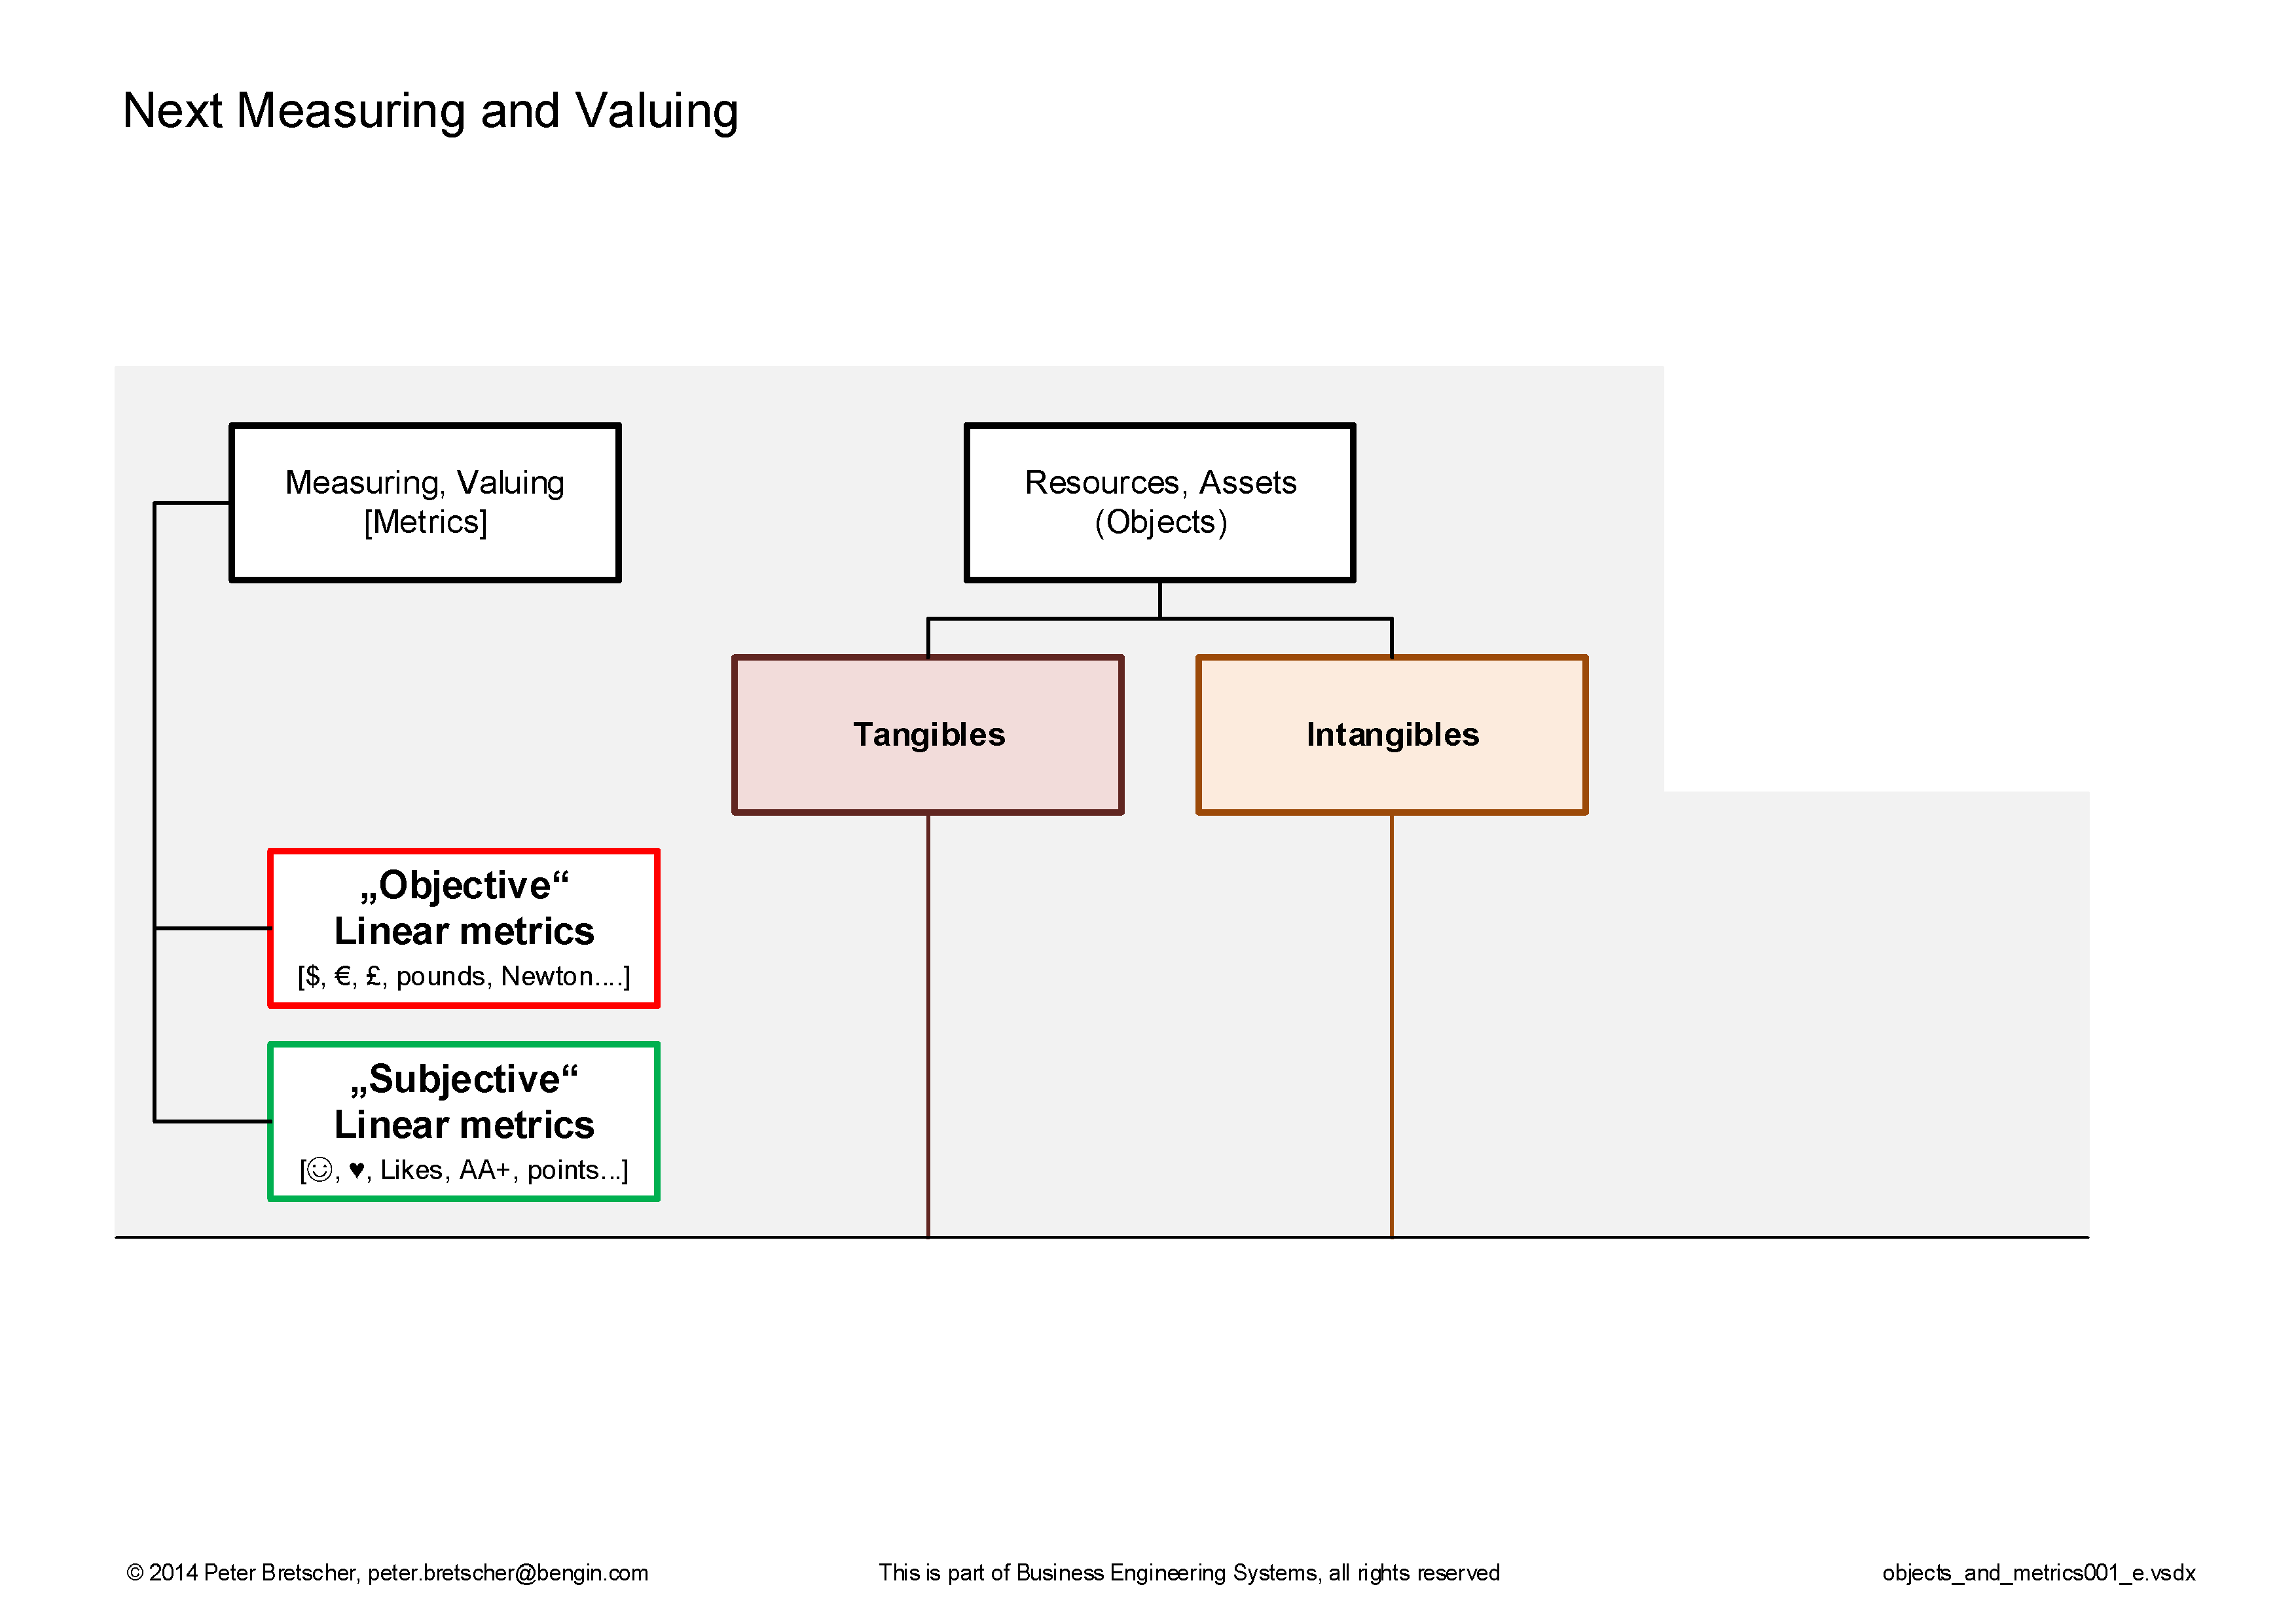
I want to make popular to talk about these items as objects. And that people attach a value-tag to the object. That value-tag has an objective (monetary) and a subjective (non-monetary) dimension (metric). Such a 2D-metric (hybrid-metric) enables to combine for example an investment with a weight (a priority).
Weighting investments is a standard in decision making. But by multiplying weight with investment you get a single number only and lose the important "information of weight". And that loss often leads to bad decisions.
It's not easy to think in 2D-metrics if you have numbers only. And it may be impossible to share the insights you got with less experienced people. But by visualizing investment and weight on two perpendicular axes you may reach better discussions with your peers because you have the same picture in your mind. And you can bring in your arguments about the "real" weight in relation to the investment.
More generalized the vector helps to visualize the interdependence between any type of metrics and discover differences of "objects" in an instant.
Such "objects" could be even nations, enterprises, profit centers, projects... and the indicators may be profit, cost, GDP, invest, storage space, risk, illness days, quality, CO2 output, waste, well-being index...
Download Excel templates to make first steps with your data. Even drill-downs can be made without buying a special software.
Links to further informations:
- Link for downloading animation as PDF
- Explaining paper about "Vector based Performance Measurement"
- Link to Vector Applications
- Link to more samples and presentations
- Vector templates to start with your own data
"I often say that when you can measure what you are speaking about and express it in numbers you know something about it; but when you cannot measure it, when you cannot express it in numbers, your knowledge is of a meager and unsatisfactory kind: it may be the beginning of knowledge, but you have scarcely, in your thoughts, advanced to the stage of science, whatever the matter may be."
Lord Kelvin, Electrical Units of Measurement, 1883
Objects and Metrics
Make it as above Vector metric) for all objects (tangible AND intangible) and add this two vectors to the Sum = Total Hybrid Vector in No. 6.
Get objective and subjective dimension (weight) in one picture and discuss investment AND its weight with your colleagues.


