Problem: Getting beyond Systemic Failure in the base of (economists) classic world view.
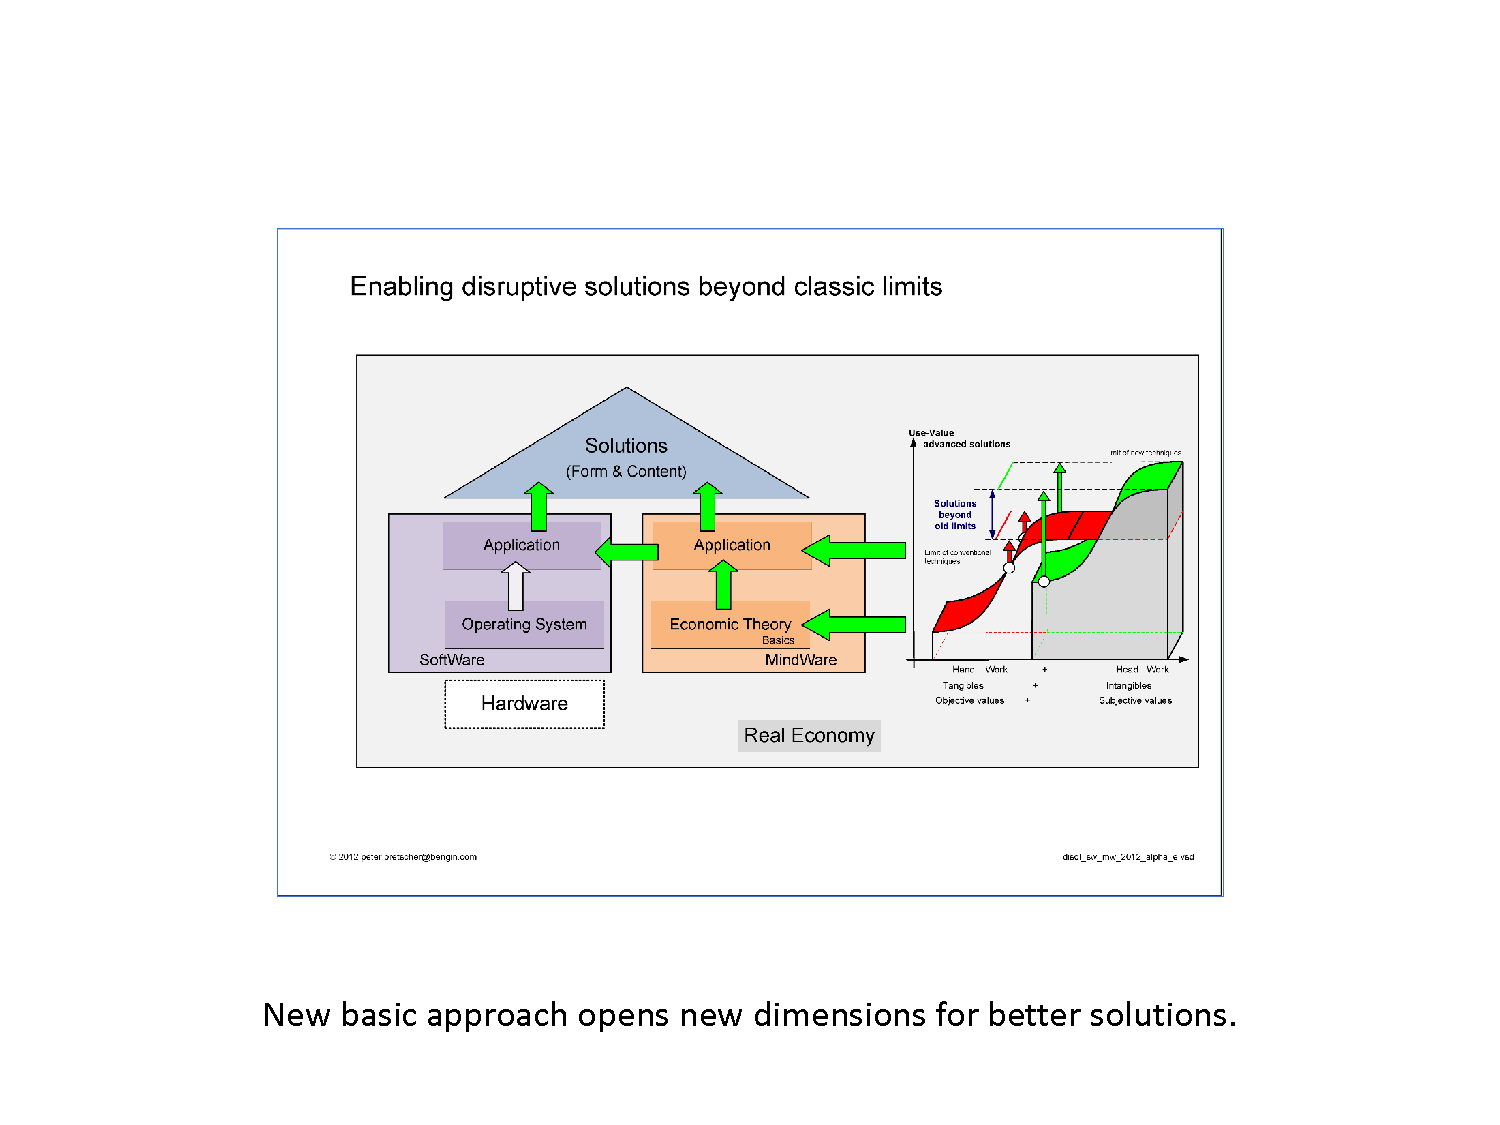
Economics is for the Mind what 'MS-Dos' was for computer. 'MS-Dos' was replaced what now is called 'Windows 10'. And 'classic economics' has to be replaced too.
There's no way to make a color picture with a black and white camera.
One has to update and enhance the basic system of the camera from scratch.
That's why we started with two innovative enhancements of the very base of the economic mindset (red = classic and green = enhancements).
First dimension is an innovative lens to the 'productive capital' (Land, Labour, Capital) replacing it by 'tangible and intangible assets'. Tangible assets is already in the classic view - intangible assets means the 'enhanced view' that is needed for explaining, understanding and design smart economy.
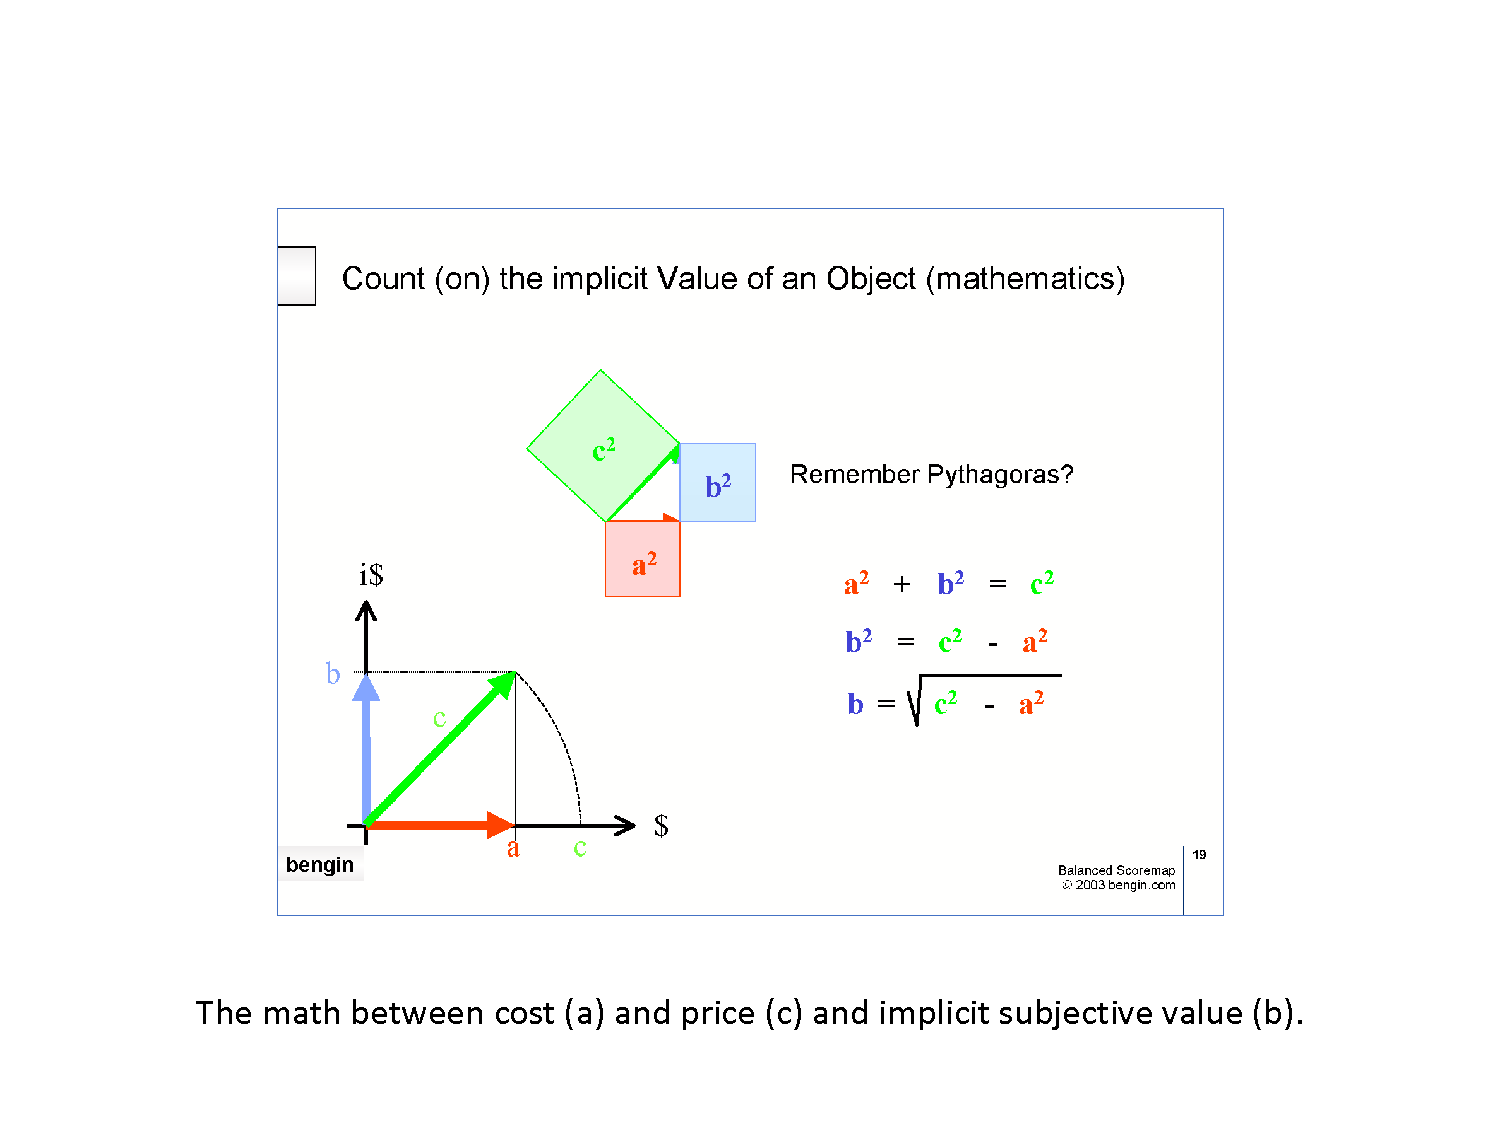
The second dimension is a vector based value paradigm (hybrid value metrics) that enables the quantitative inclusion of a subjective (non-monetary) value dimension so that it enables to differentiate between real and expected value propositions.
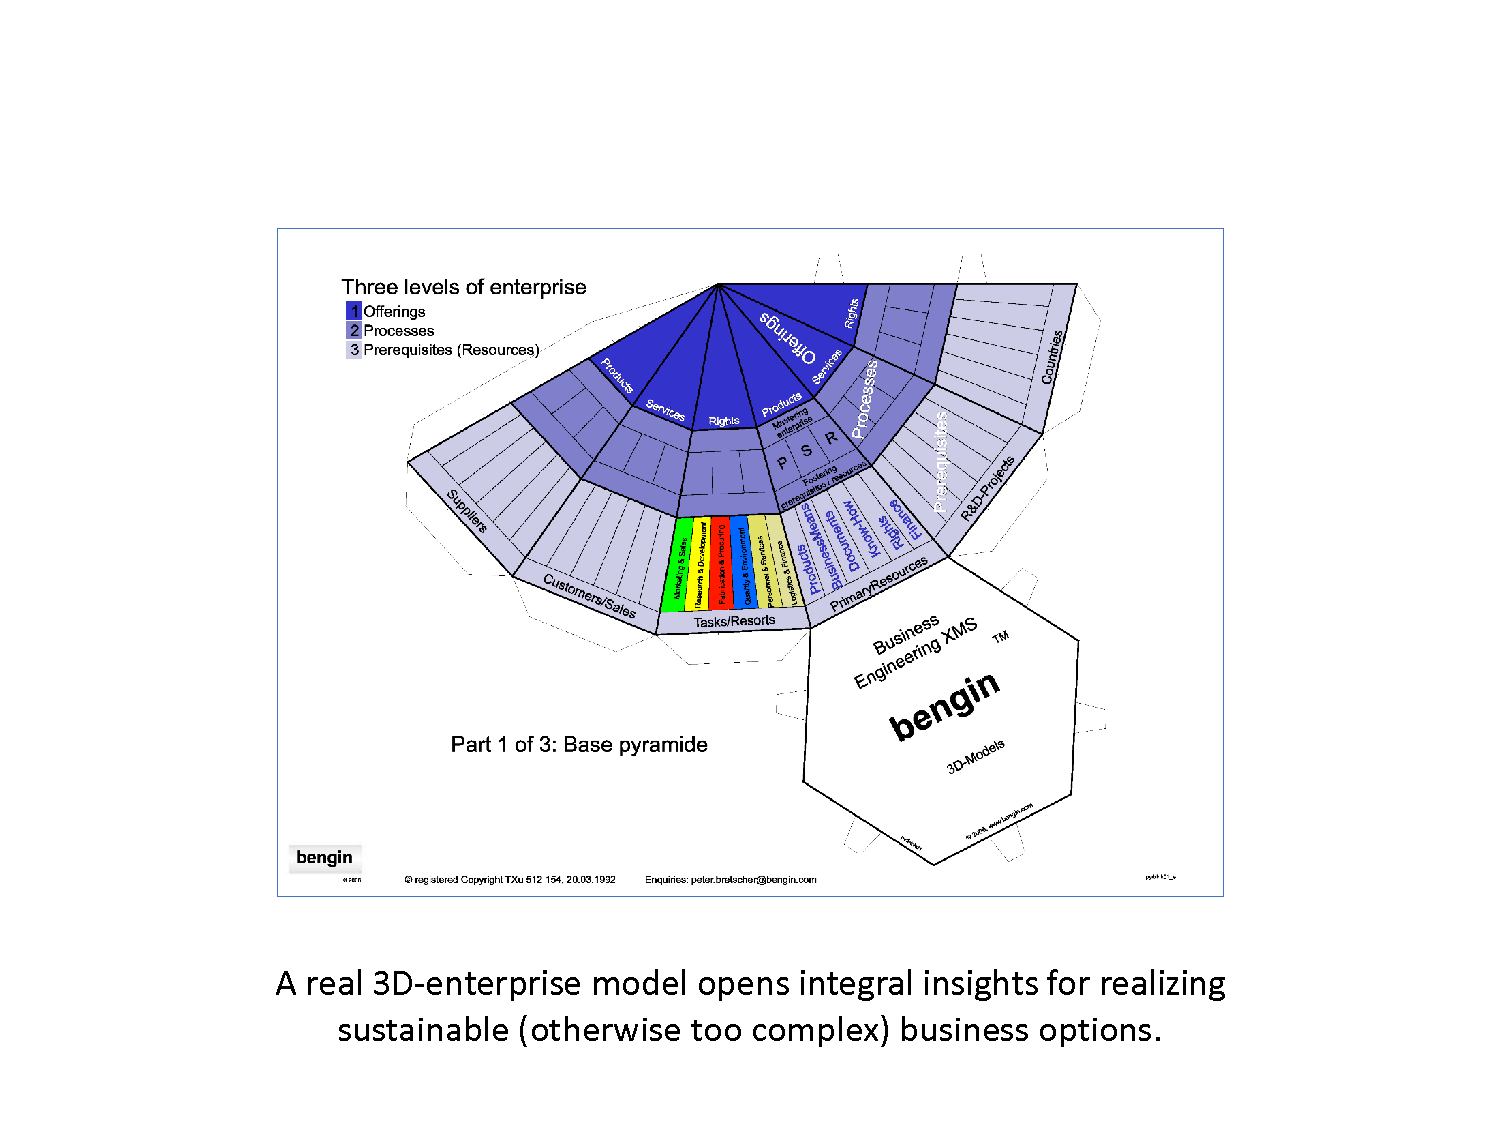
Below you find some visualizations about how simultaneous inventions in the two dimensions of (a) assets and (b) the enhancement of the quantitative economic value paradigm. Debugging the base of old economic models removes some old restrictions (by old economic paradigms) in decision making. It enables a more holistic reasoning and sustainable results.
To bypass old restrictions we started "Project NEMO" (New/Next Economic Model). Its purpose is to disclose the options for better solutions that are already available - and to enable and support future development.
You may download the pictures below as Powerpoint pptx here or the Adobe pdf here.
Powerpoint and pdf have working links to further information.
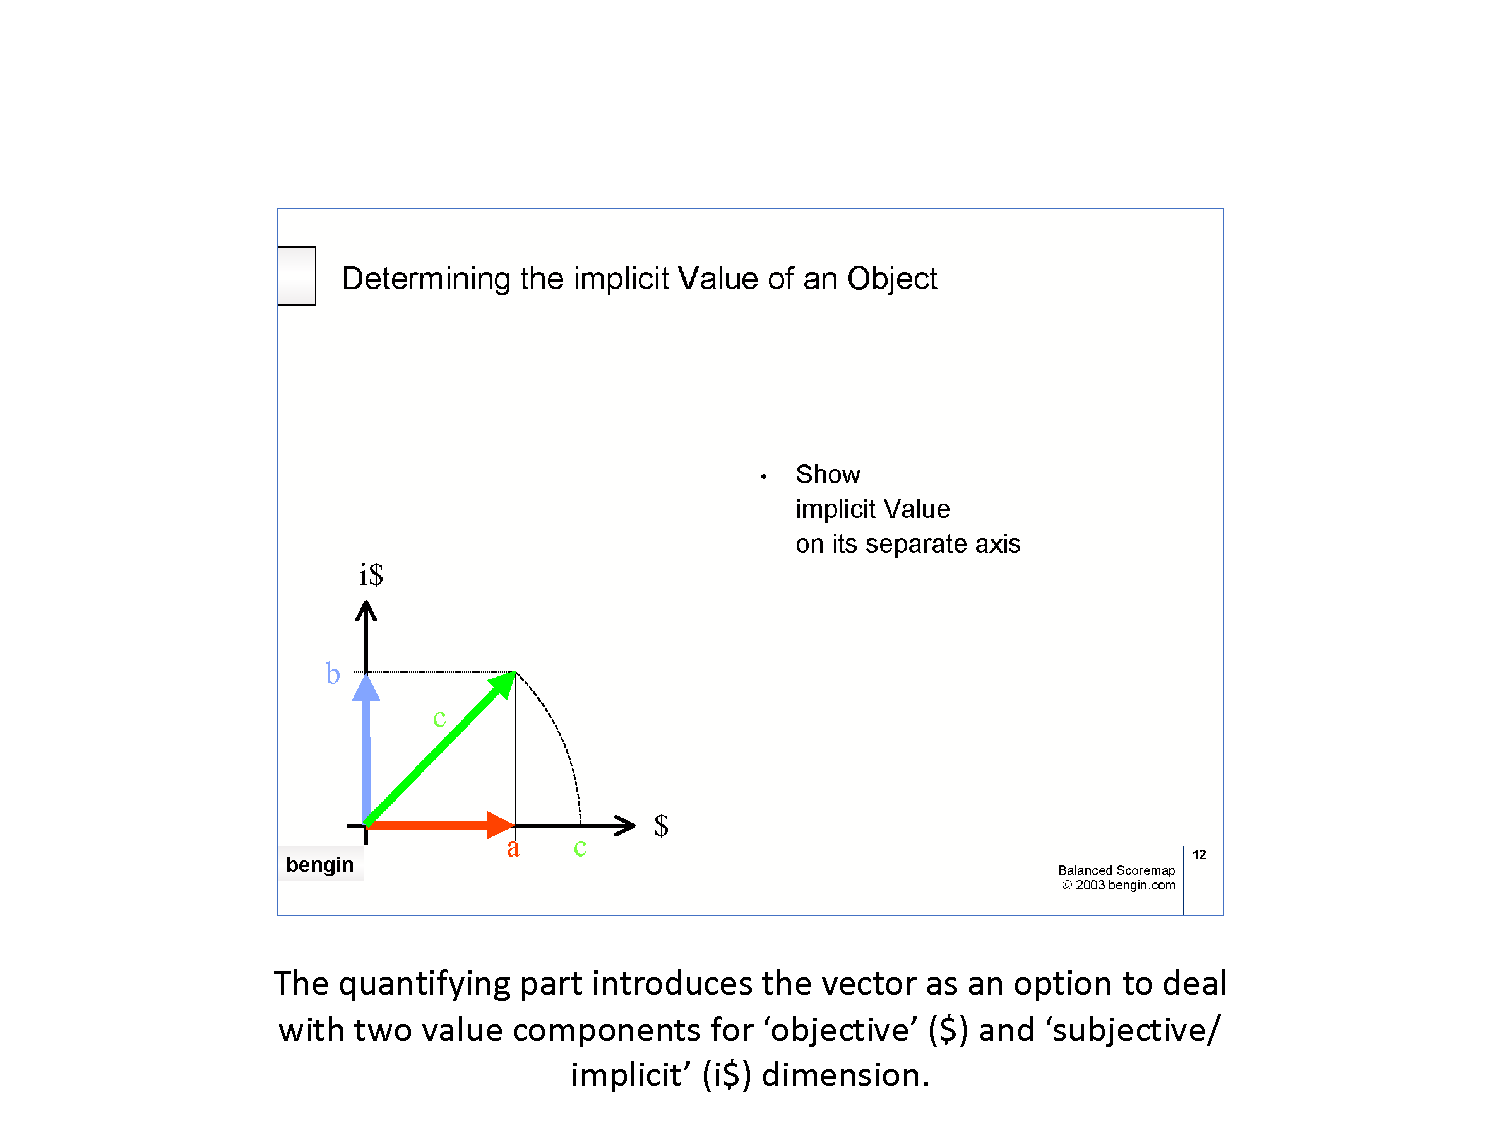
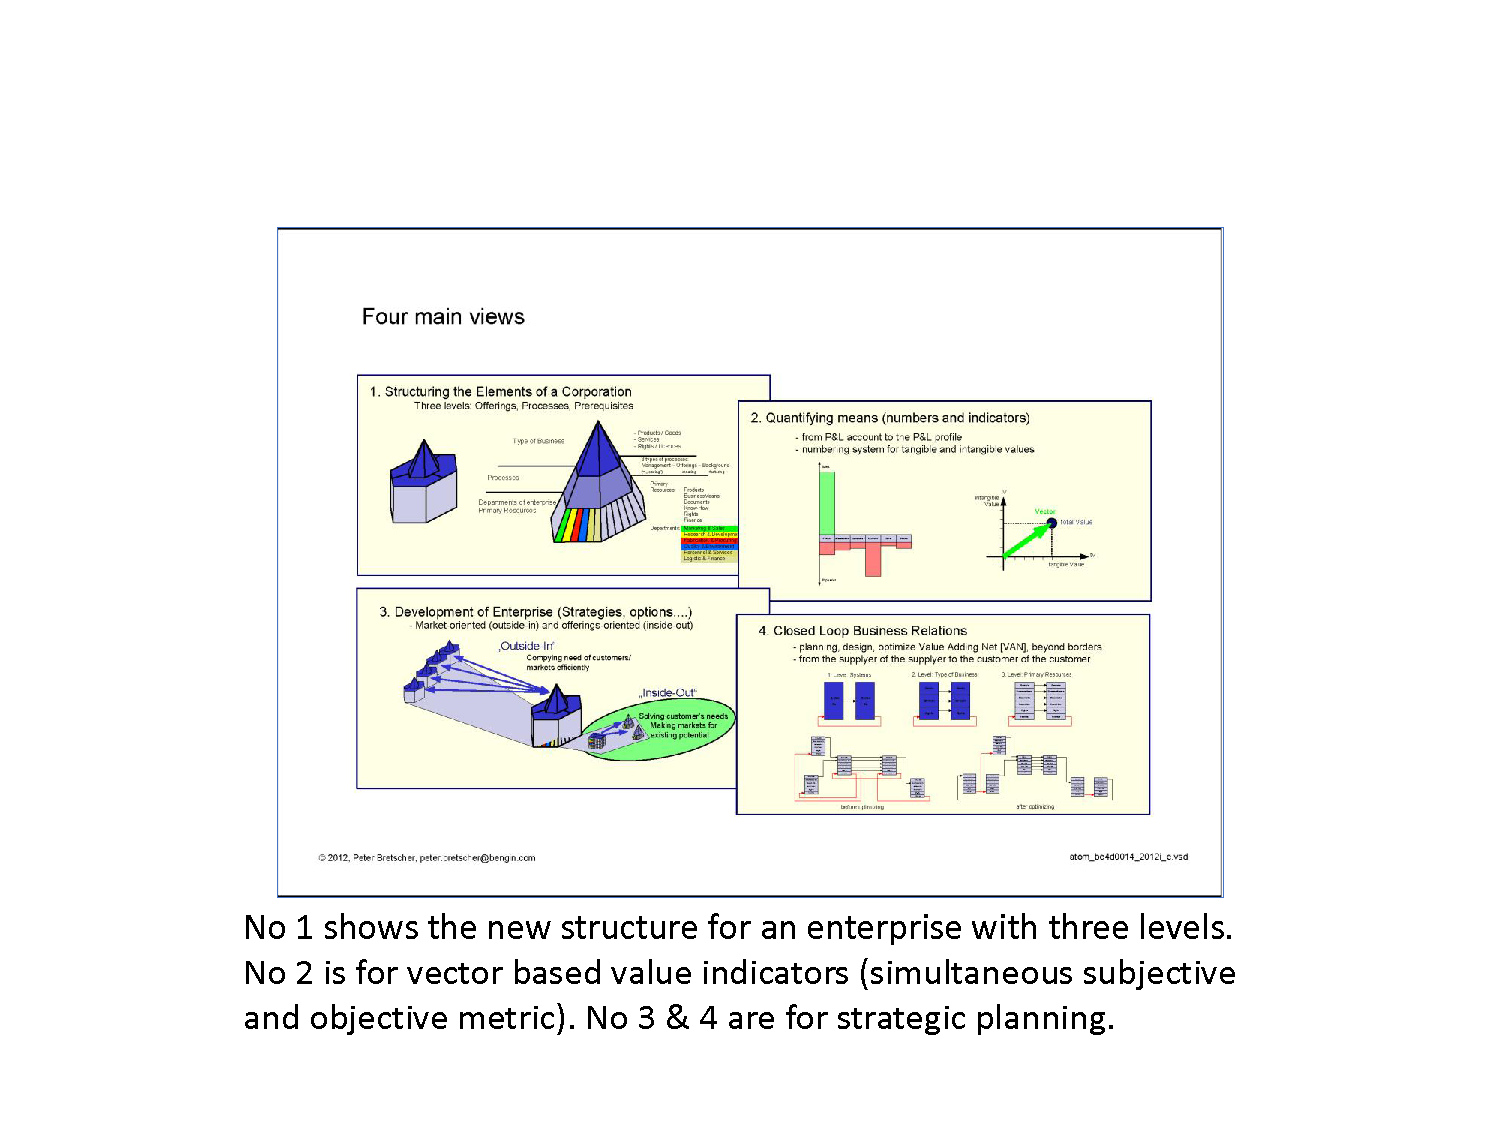
The quantifying part introduces the vector as an option to deal with two value components for ‘objective’ ($) and ‘subjective/ implicit’ (i$) dimension.
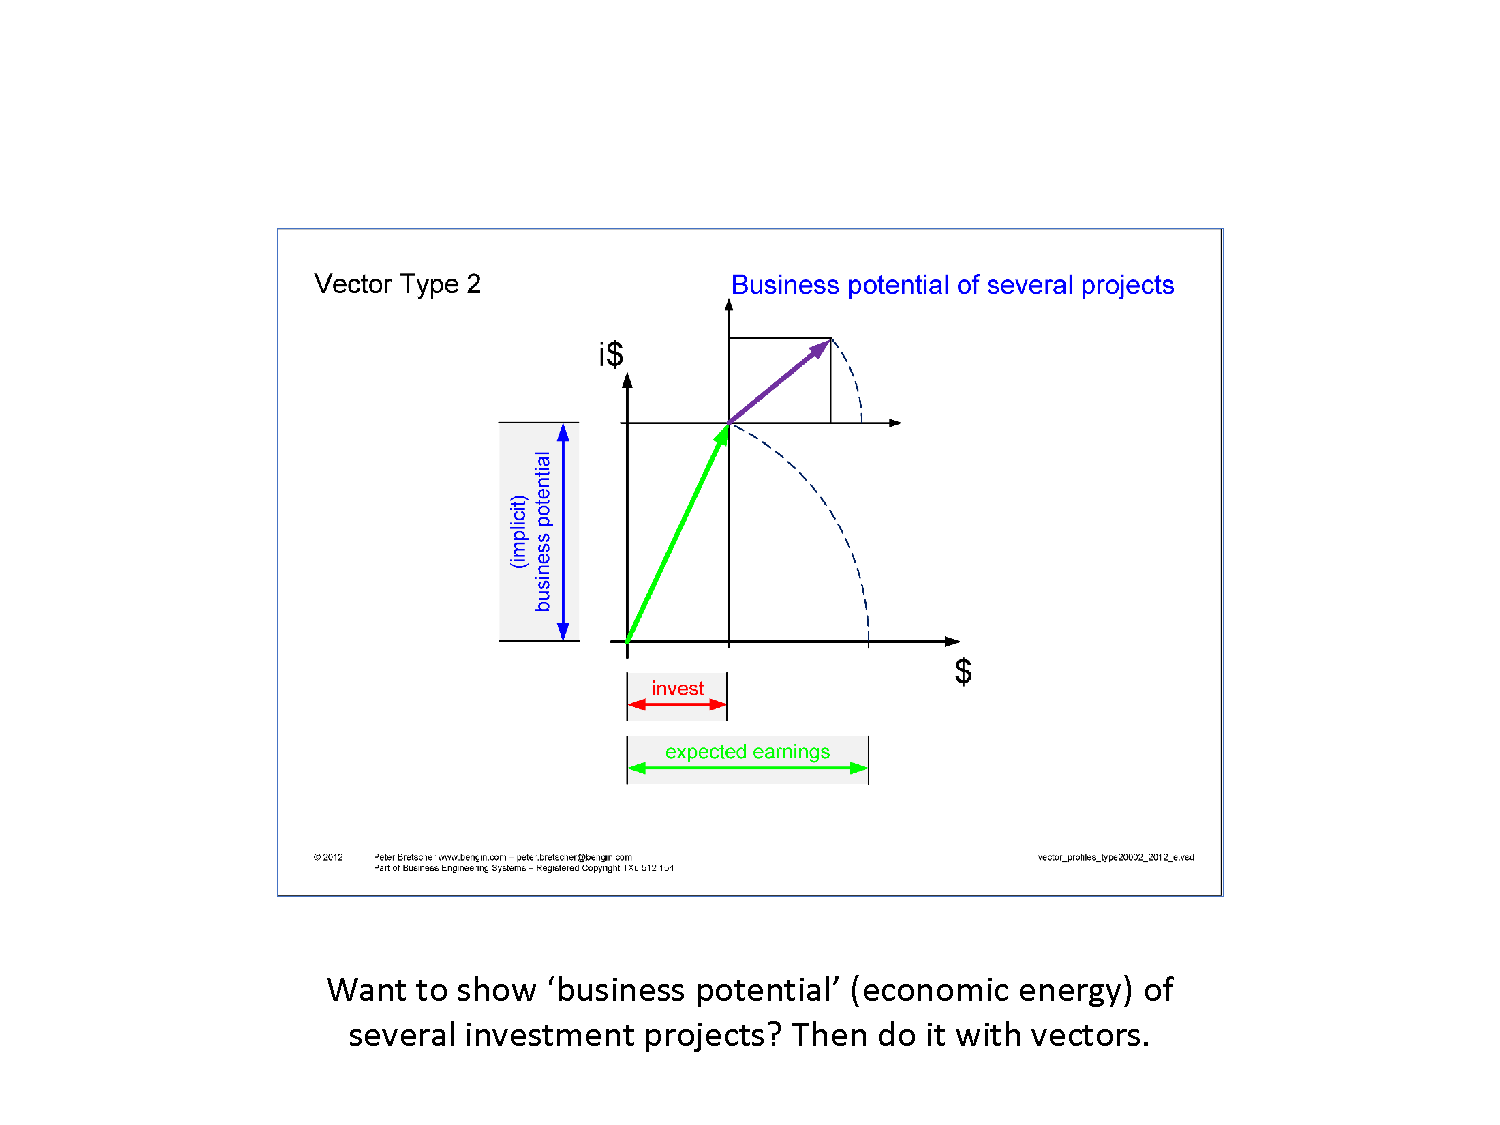
Want to show 'business potential' (economic energy) of several investment projects? Then do it with vectors.

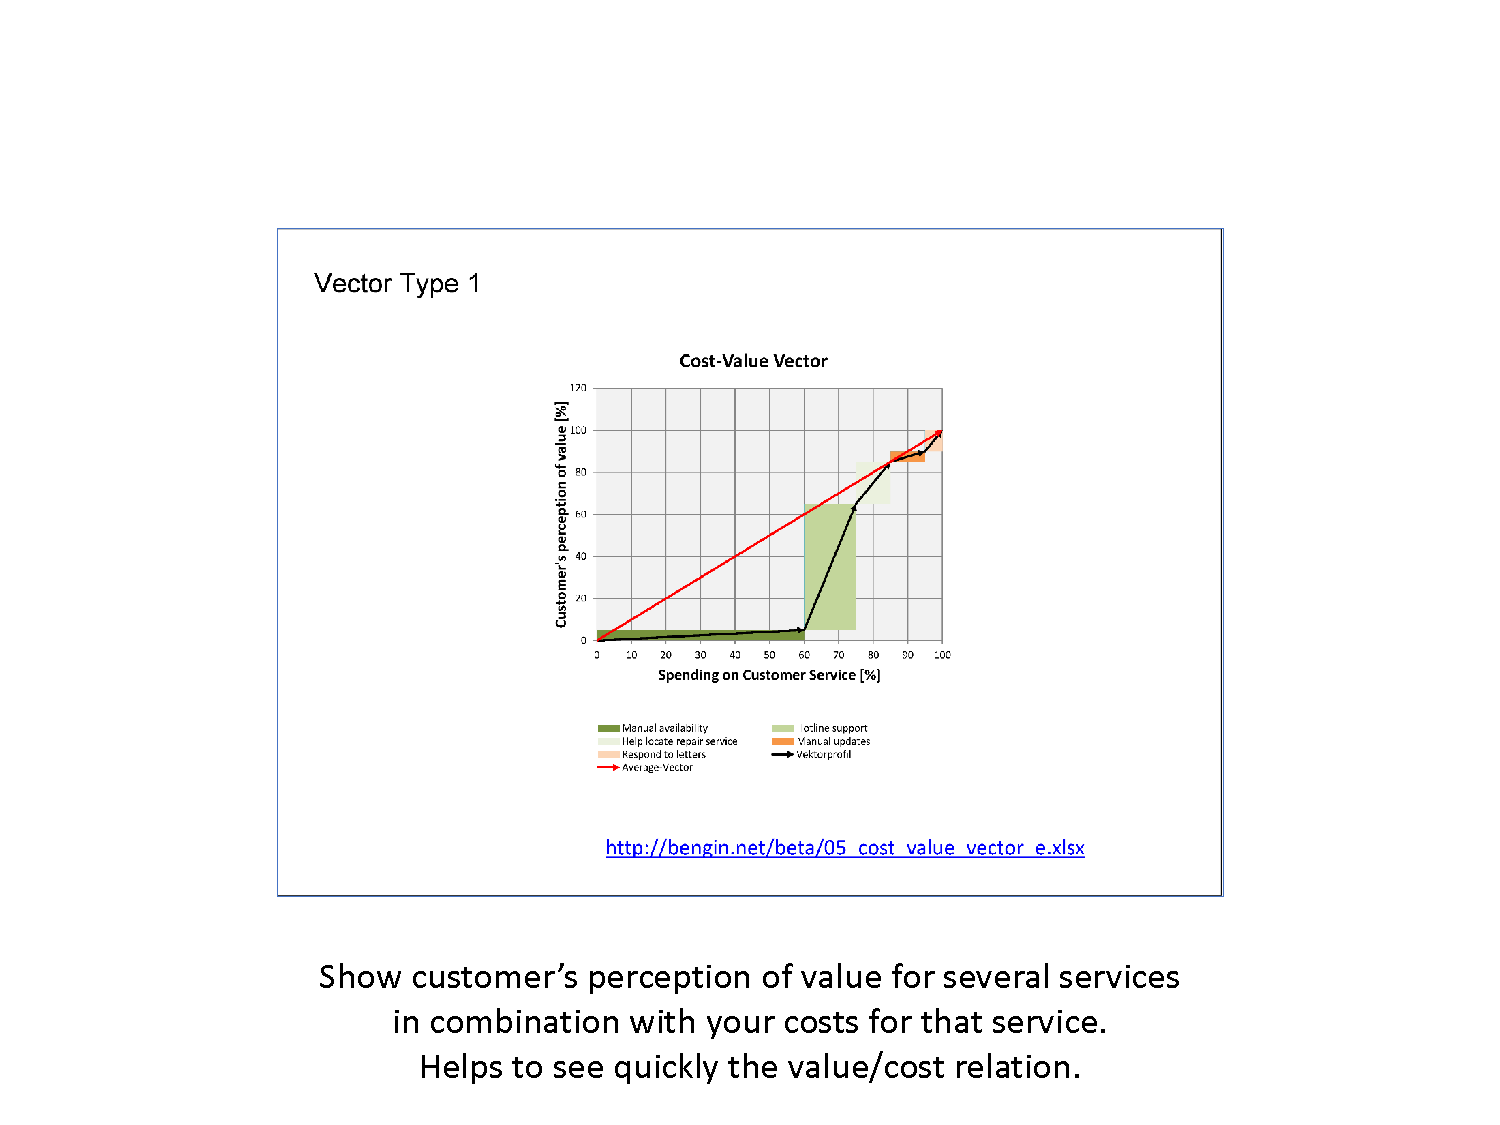
Show value profile of several objects (or budgets?) not only in $ but in % of subjective preference too.
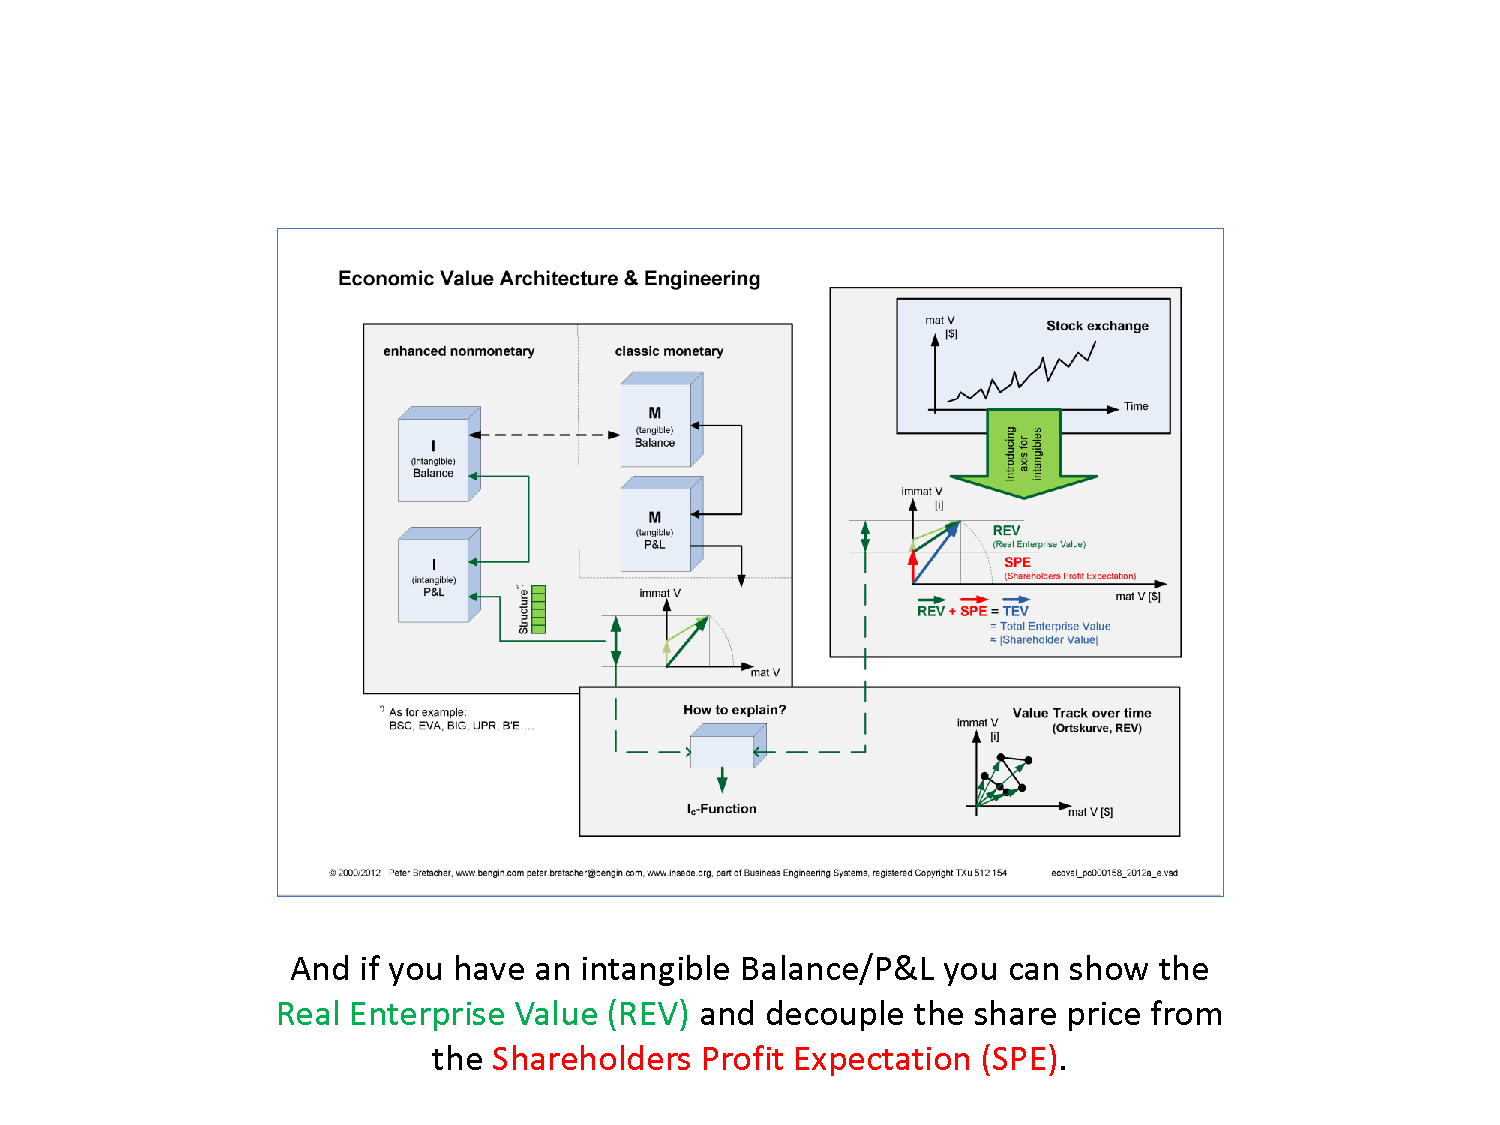
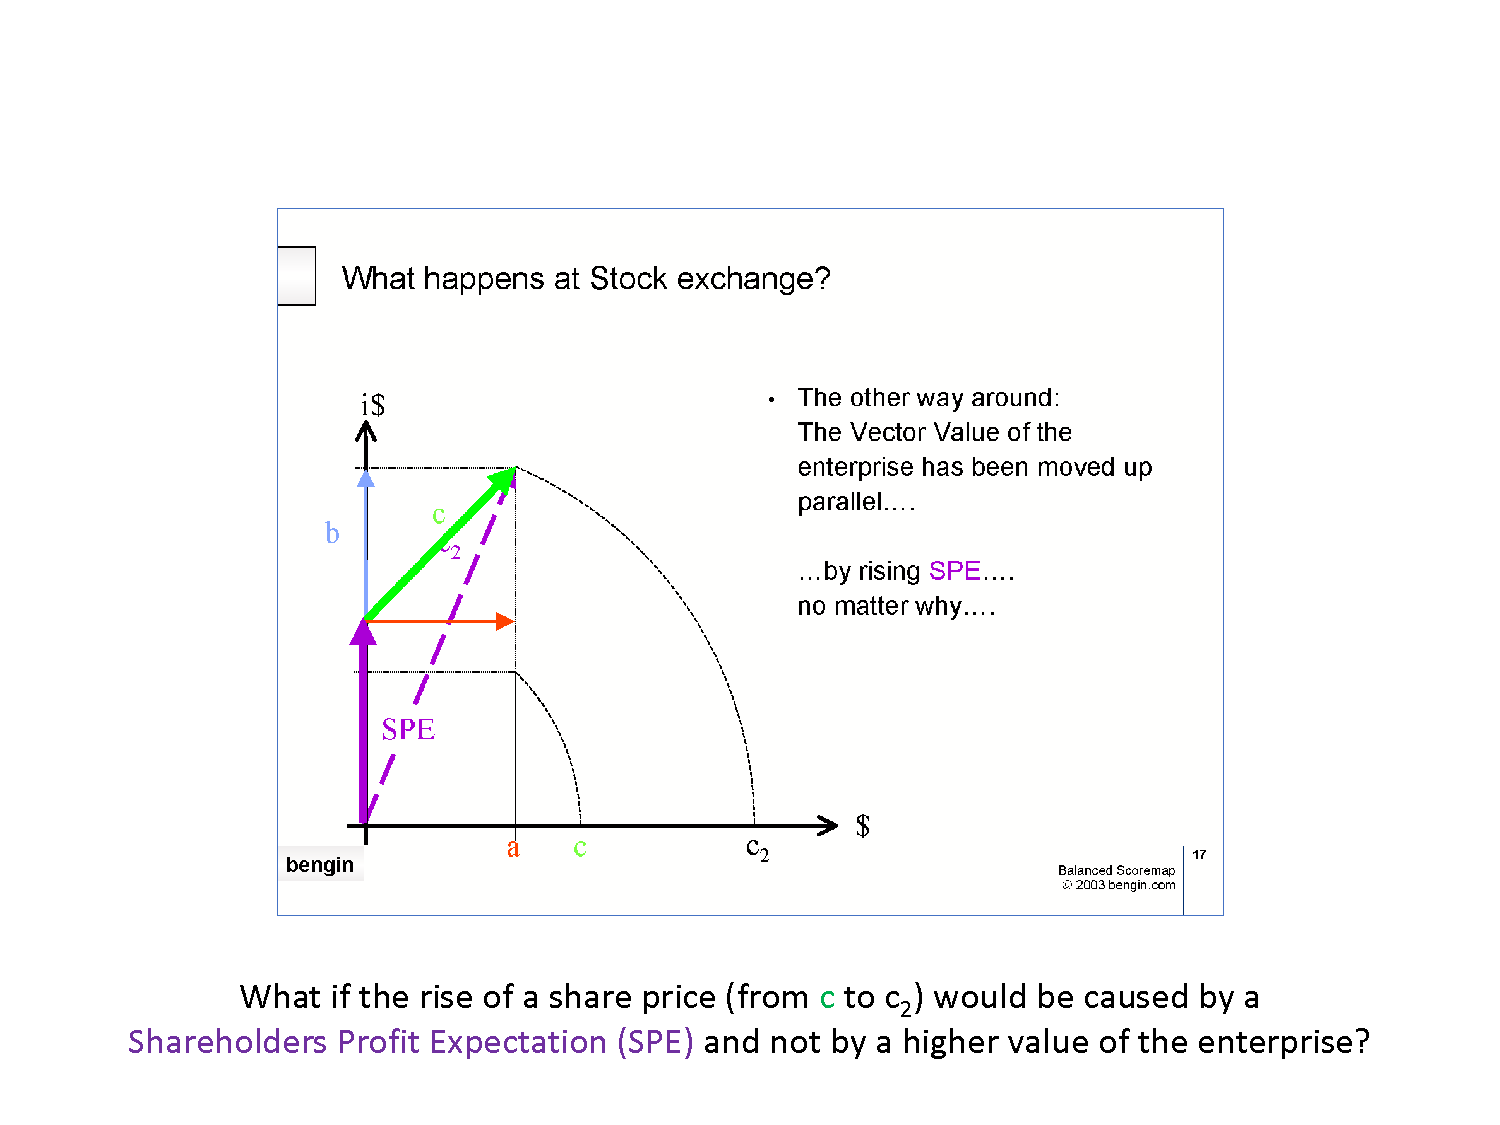
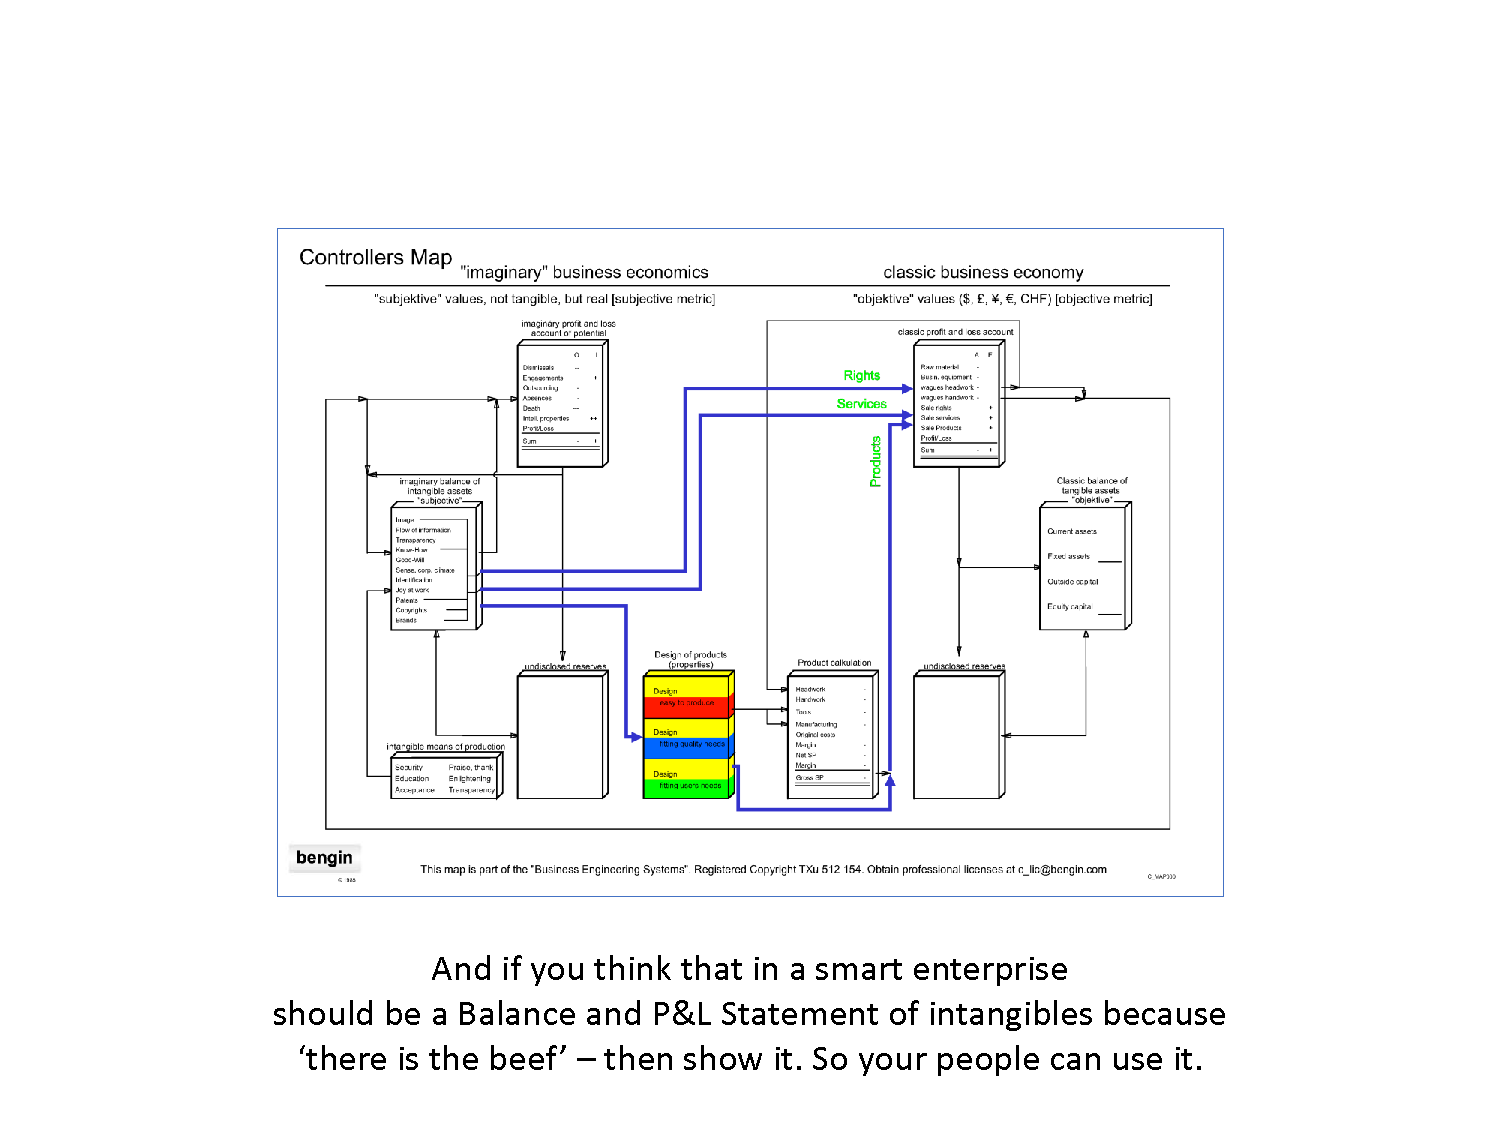
And if you have an intangible Balance/P&L you can show the Real Enterprise Value (REV) and decouple the share price from the Shareholders Profit Expectation (SPE).
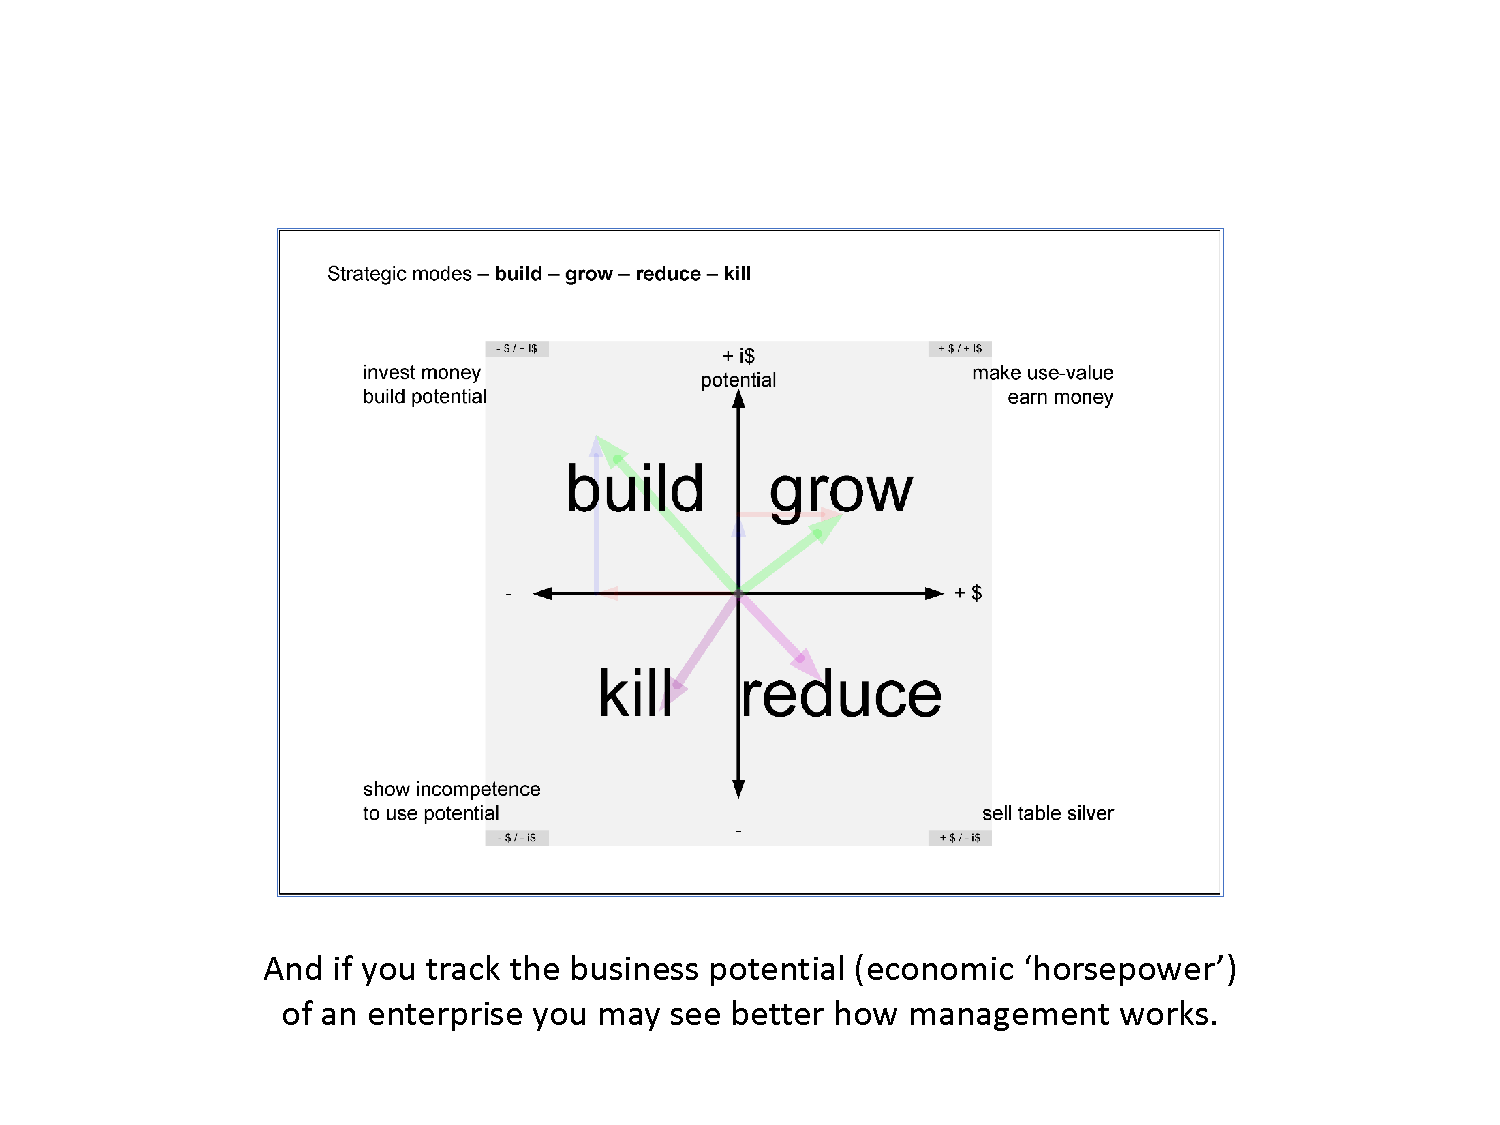
And if you track the business potential (economic ‘horsepower’) of an enterprise you may see better how management works.
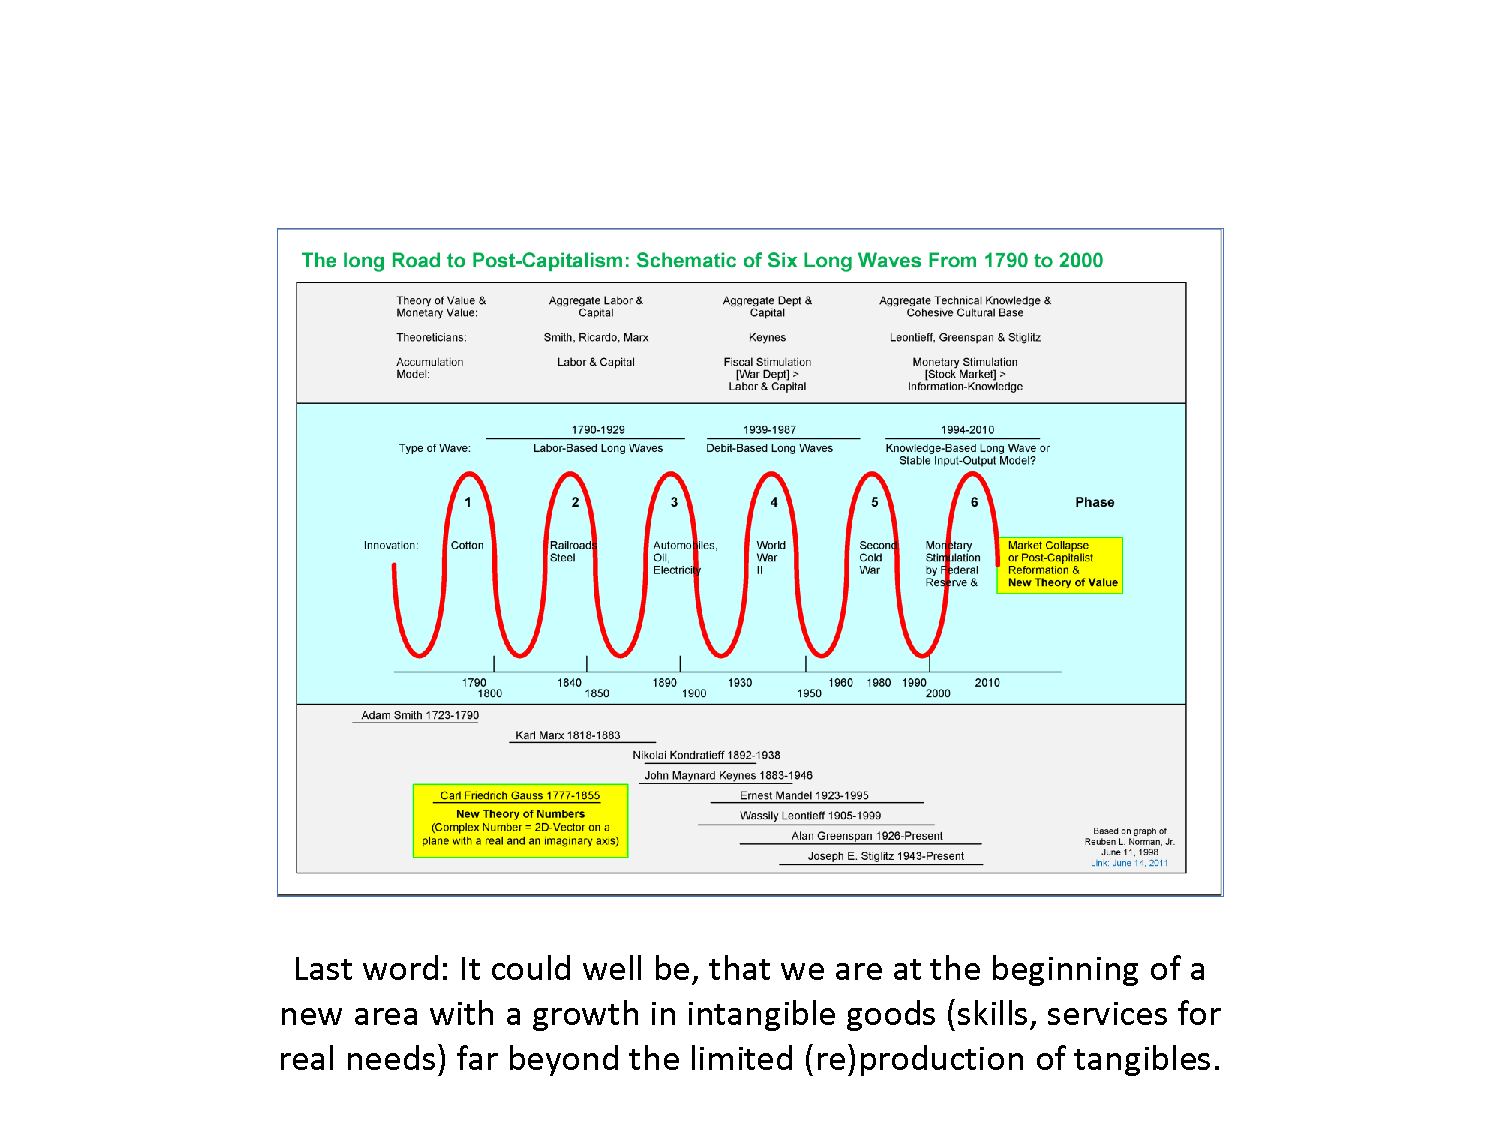
Last word: It could well be, that we are at the beginning of a new area with a growth in intangible goods (skills, services and rights for real needs) far beyond the limited (re)production of tangibles.

Want some more enhanced frameworks and value metrics?
Then go to next webpage. Click Here.


