Institute for Sustainable
Economic Development

| INSEDE Institute for Sustainable Economic Development |
|
|
Vector-Performance Profile - breakthrough in visualizing
values
(Now clear view for 36 (48) values - 3 (4) quarters, 6
business units, expenses and income)
Interpreting numbers and communicating their interrelationships is easier now.
With Excel 2010 - even without macros.
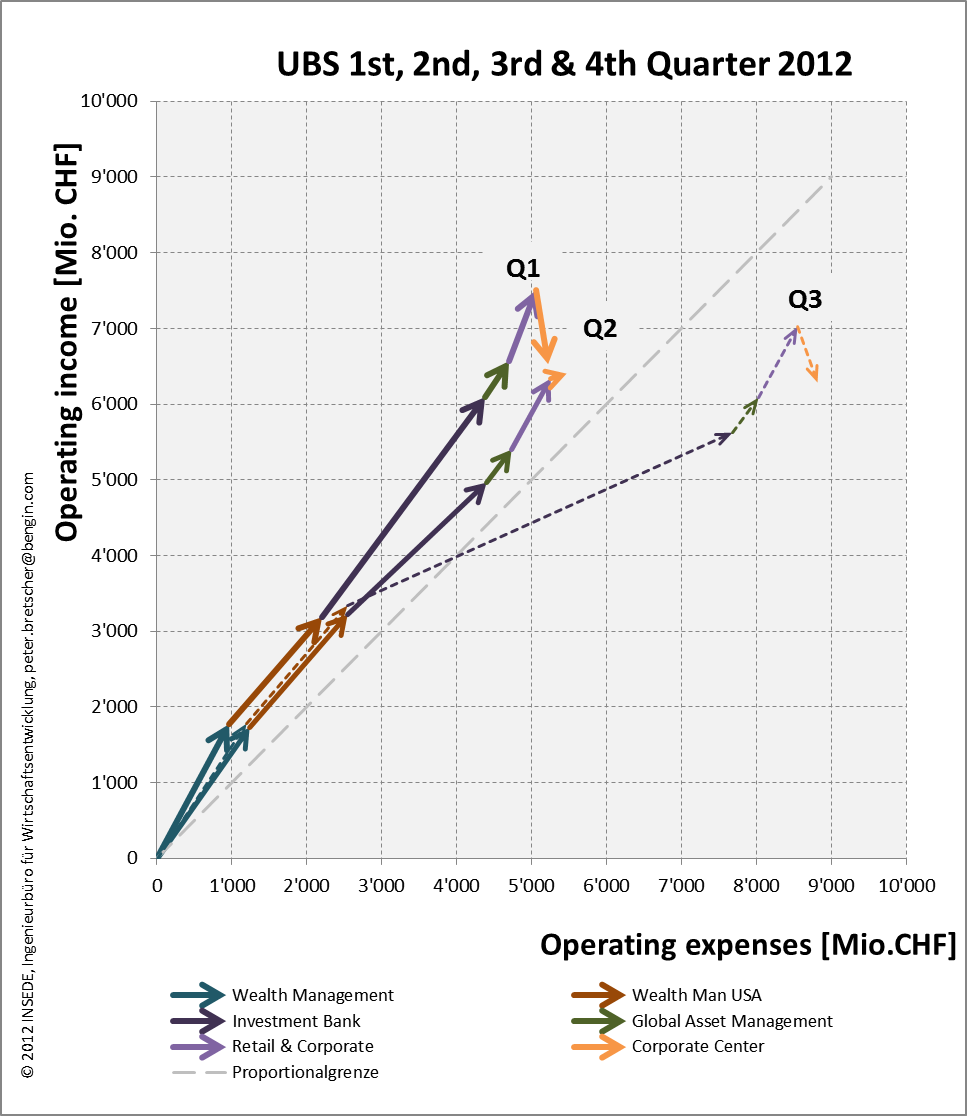
The picture below shows profiles of three quarters of UBS 2012.
Vector = business unit, x-axis = expenses, y-axis = income
Steeper vectors => better performance.
The illustration below is an interactive ExcelWebApp.
In usual browsers you can change the data - you may even fill in the expected
values for the fourth quarter - and the graph is recalculated in
your browser (changes are not saved).
Try it with your own Excel 2010.
Download template here:
http://www.bengin.net/beta/UBS_1st_2nd_3rd_4th_quarter_2012_e.xlsx
If you intend to use this vector principle please keep in mind that it is part
of the "Business Engineering Systems" an evolving proprietary set of tools; registered Copyright TXu 512 154, March 20, 1992;
Private use is free; no derivatives. Commercial use (consulting, education....) needs individual license...
ask for options.
This license is part of the business model of INSEDE, that allows us to develop
and spread solutions for a more sustainable economy.
Additional samples? See the first ten of Fortune 500 here:
http://bengin.net/beta/bengin_forbes500_2011_e.htm
More Excel templates for trial? Look here: http://bengin.net/beta/basic_master_e.htm
Found an issue? Want some more information? Like to be on our email list for
news, to work with us? Want to support?
Thanks for mail: Peter Bretscher
peter.bretscher@bengin.com
@ Google+:
https://plus.google.com/107048744275438760860/posts
INSEDE @ Google+