Institute for Sustainable
Economic Development

| INSEDE Institute for Sustainable Economic Development |
Beyond (classic) BI cockpits - prerelease |
|
Want to show the relationship between monetary and nonmonetary indicators and values?
(or the relationship between monetary and monetary or even nonmonetary and nonmonetary indicators)
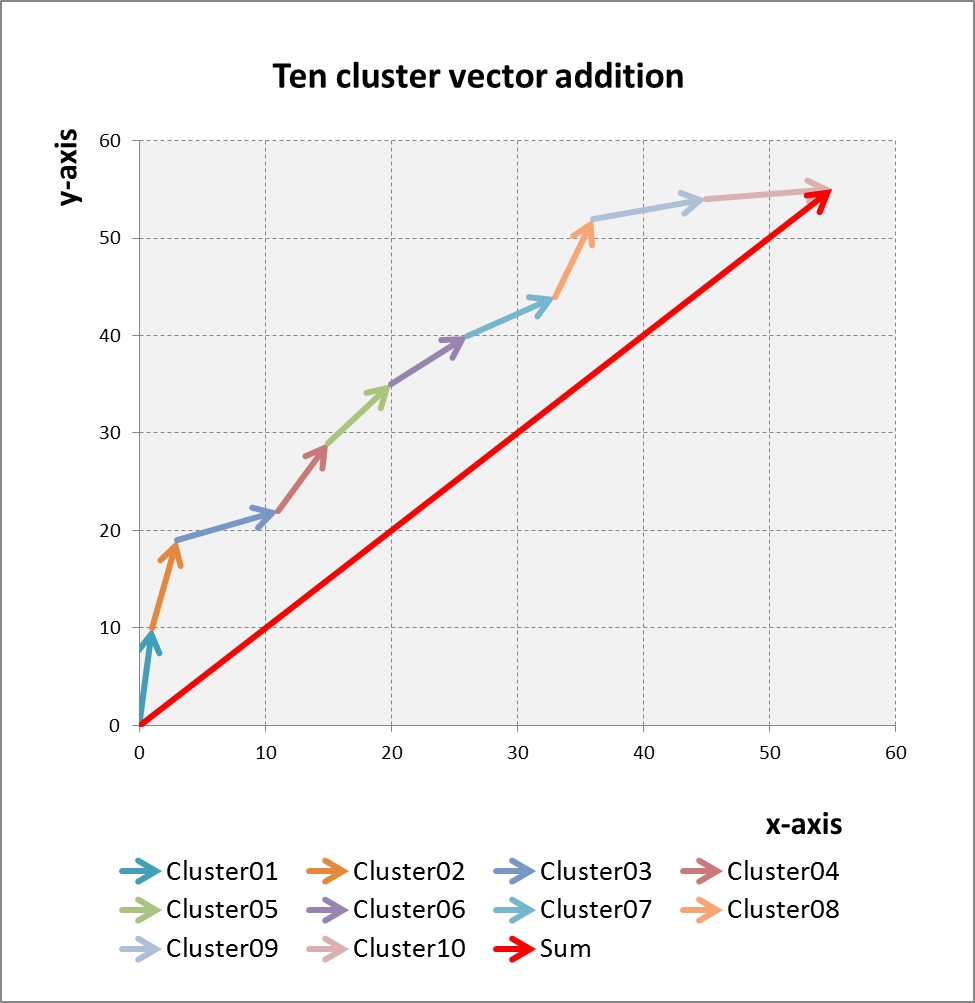
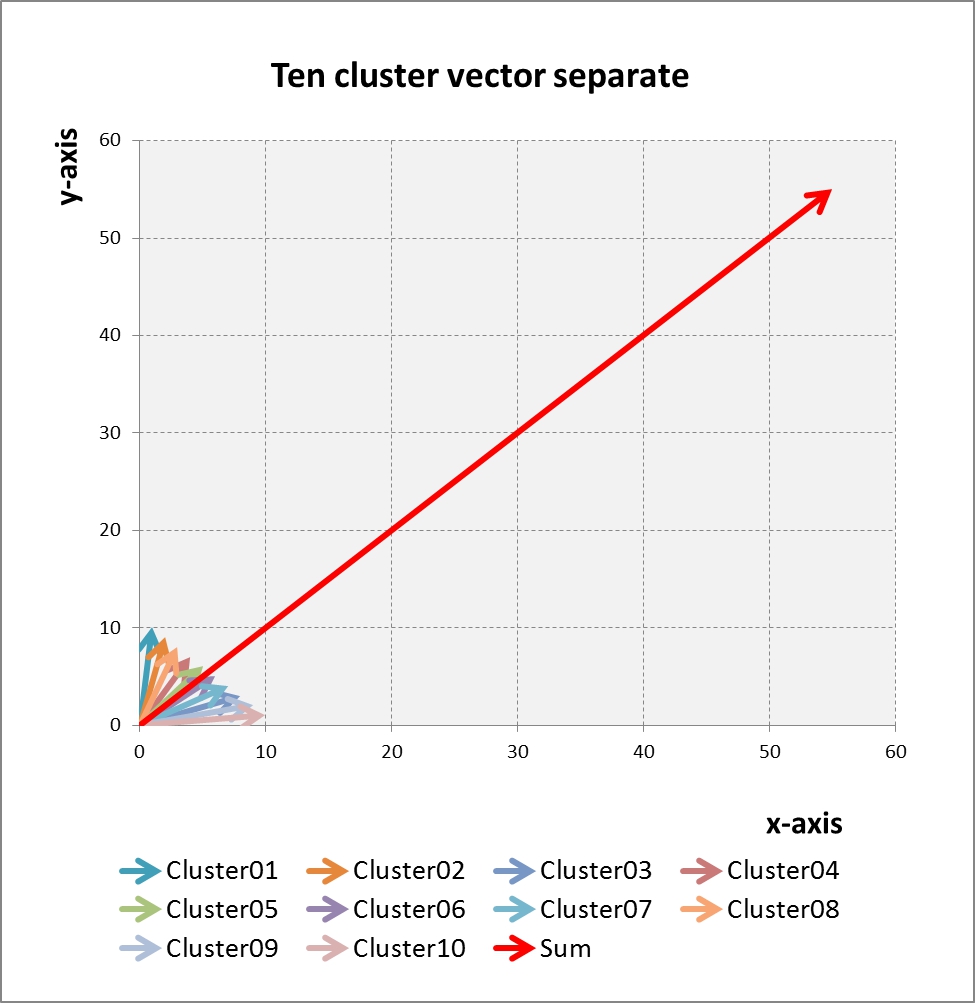
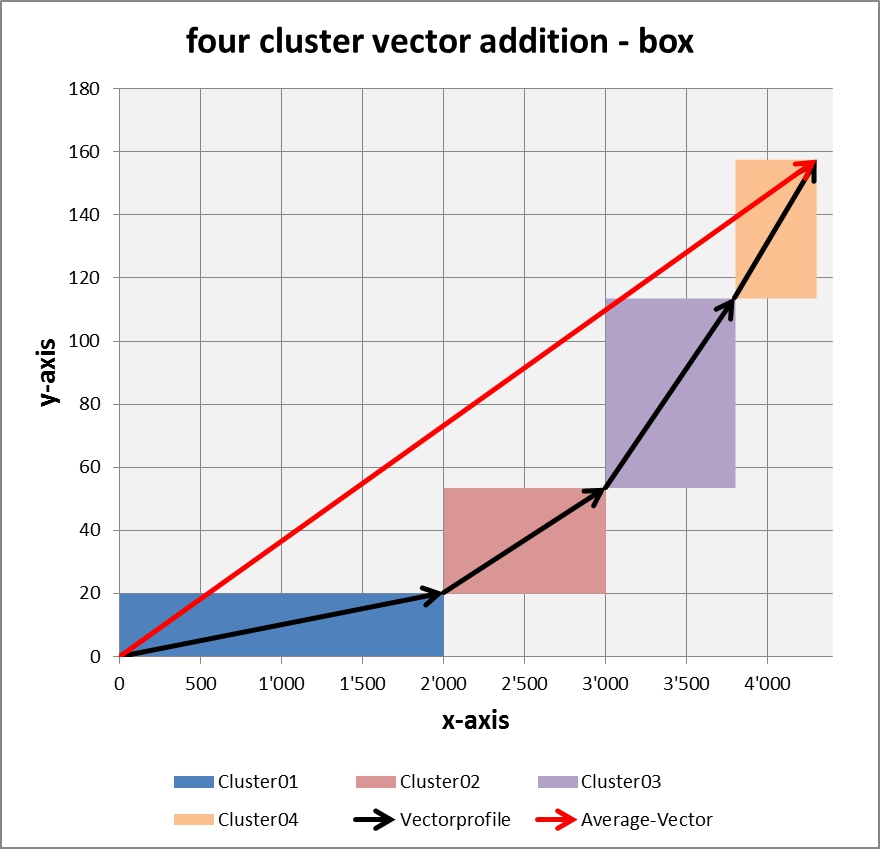
This is the solution: kpisquare and Vektor Profiles.
On this page you will find different templates for Excel vector profiles for
download.
Click on the picture shows the large version and click on the link on
the right side of the picture downloads the Excel file(....xlsx).
The templates are unprotected and free from macros/VBA.
You may use it free for your personal and noncommercial use. See Creative
Commons License below.
Tips/Recommendations:
look for the template, which contains at least that number of clusters that you want to consider. (Not required clusters may be set to zero. The index may be revised direct in the chart.)
Use for comparison of data sets - for example, budget and account of two companies or business cycles or.... - the pure vector representation (without colorized rectangles). Use it for comparing monetary with monetary - monetary with nonmonetary and nonmonetary with nonmonetary indicators. You may be surprised about the new transparency you will gain.
Make "Drill-Downs" by copying the first page behind that page so much times as you have "clusters". Then structure the elements of the "sub-clusters" according to your needs and link the sum to the corresponding field on the first page.
Connect your internal data with external data from web.
|
||||||||||||||||||||||||||||||||||||||||||||||||||||||||||||||||||
| Legale notes: Pictures are proprietary and part of "Business Engineering Systems" (Registered Copyright TXu512154). Private use is permitted without license - derivative works and commercial use requires registered license (enduser, consultant, education, software...).  This work is licensed under a Creative Commons Attribution-NonCommercial-NoDerivs 3.0 Unported License. Questions / feedback / what's in the pipeline? It's not easy to see the difficulties people who are not familiar with Excel would have to modify the charts to their needs. Therefore you may send your possible questions (problems with downloads, additional links, special excel manual, license rules....?) to peter.bretscher@bengin.com So we can modify this page in that it better fits your needs. Peter Bretscher, Ingenieurbüro für Wirtschaftsentwicklung, Alpsteinstrasse 4, 9034 Eggersriet, Switzerland Mobile: ++41 79 650 49 04 |
||||||||||||||||||||||||||||||||||||||||||||||||||||||||||||||||||
| © 2012, Peter Bretscher,
peter.bretscher@bengin.com
- bengin.net -
insede.org Ingenieurbüro für Wirtschaftsentwicklung, Alpsteinstrasse 4, CH-9034 Eggersriet, Switzerland This page rests active to serve as archive. Go to new version: HERE |