Institute for Sustainable
Economic Development

| INSEDE Institute for Sustainable Economic Development |
|
|
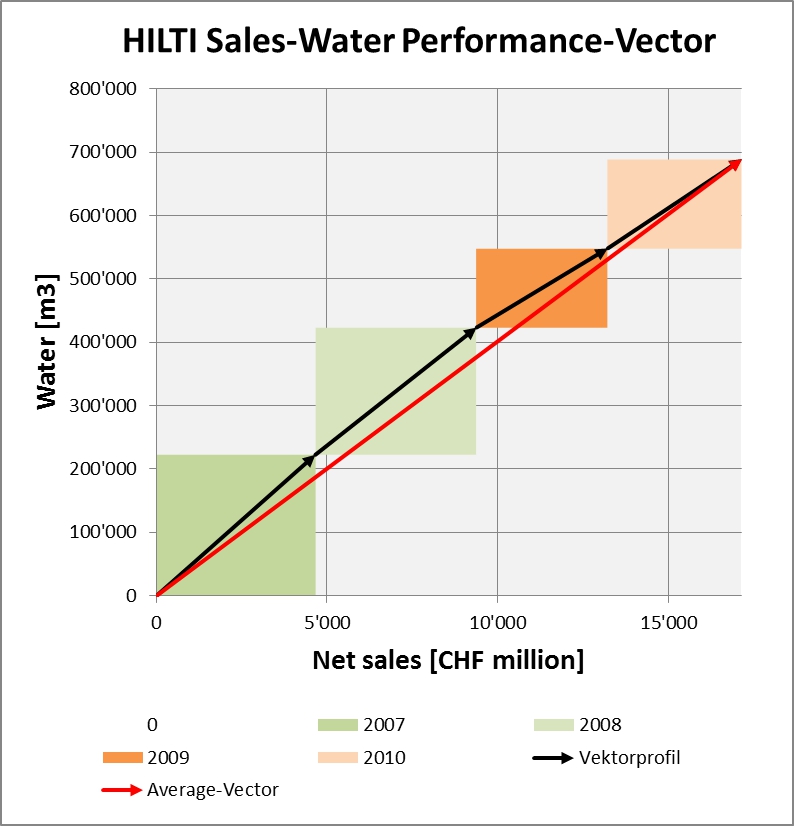
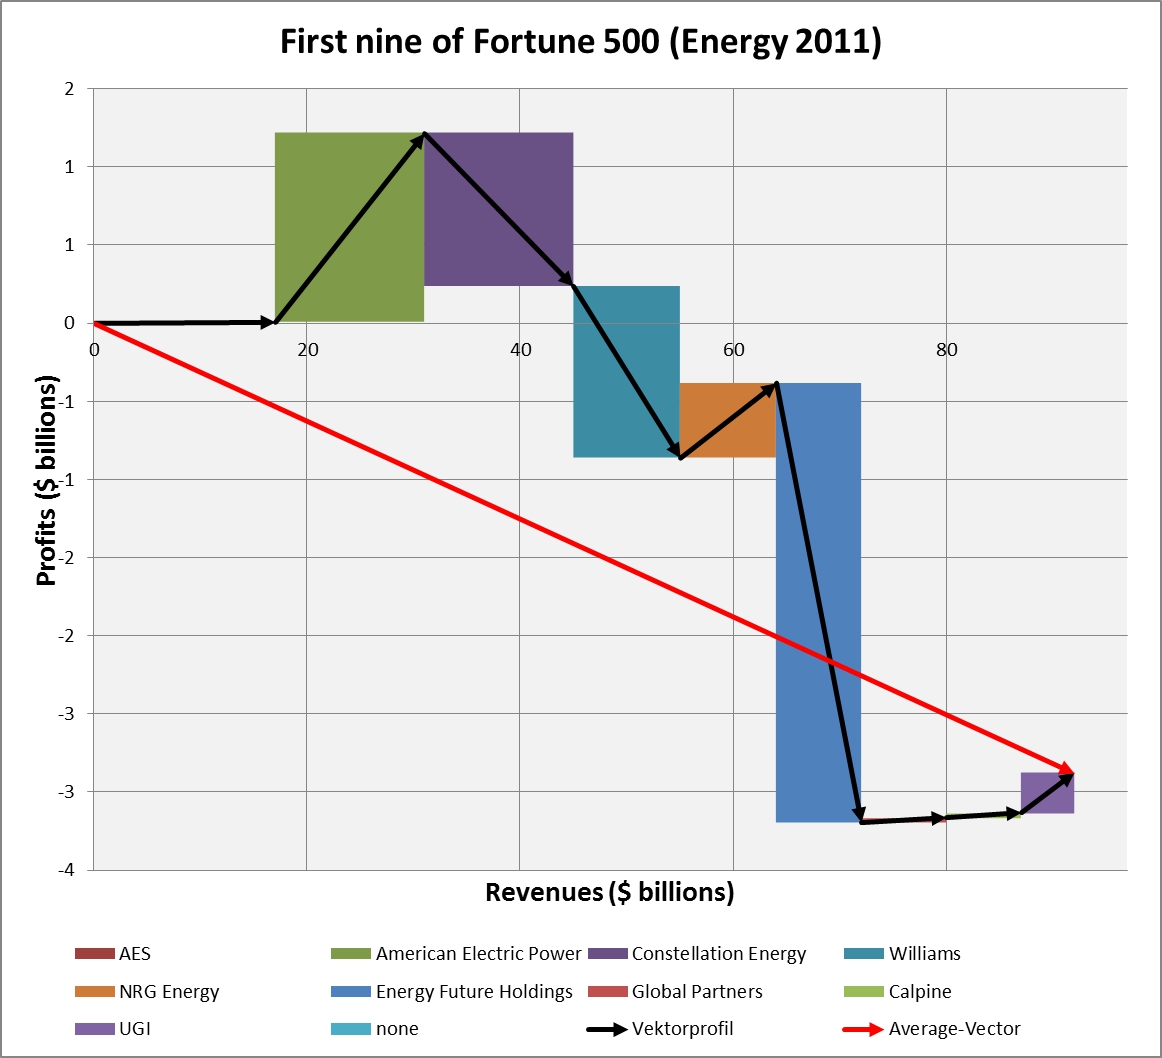
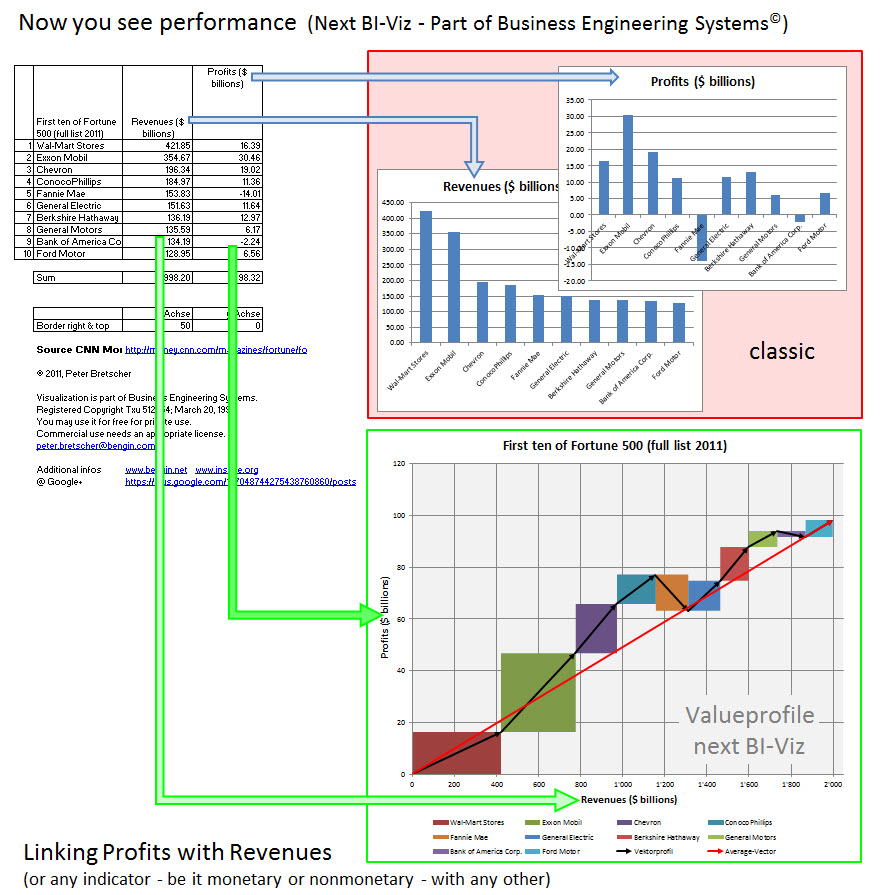
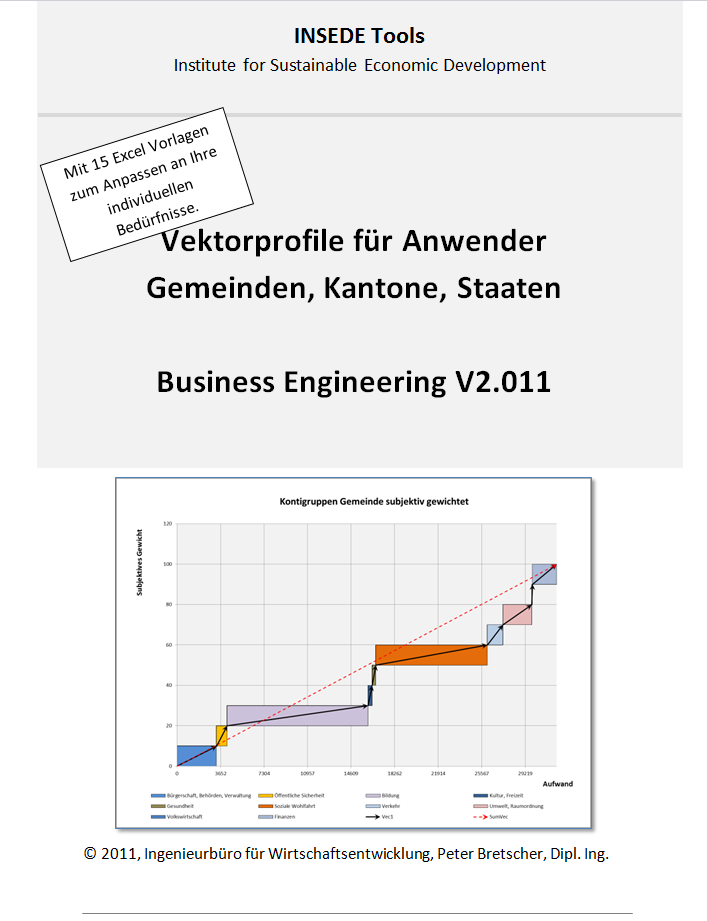
kpisquare and vector profiles - this is how correlations now become visible and communicable
On this page you can see different templates that visualize two indicators (monetary, non-monetary, subjective, objective) for different clusters (markets, departments, profit centers, subsidiaries, business units...) in a single presentation.
To the right of the illustrations you will find a link where you can download the corresponding file for Excel 2010 (for your personal, non-commercial use). For more information about the origin of the data etc., please refer to the Excel file.
You can use the templates for your own data. The files are not protected, contain no macros and do not exchange information. The elements in the charts can be changed with the usual Excel commands.
Hint/Recommendation:
Look for the representation which contains at least the number of clusters you want to consider. (You can "zero" clusters that are not required and edit them in the chart as desired).
Use for the comparison of data series - for example of budget and invoice or two companies - the pure vector representations (without colored rectangles). Although the interpretation takes some getting used to. But the transparency of direct comparisons improves, and the limits of application are almost unlimited.
You get "drill-downs", if you copy the first page as many times and "put behind" the first page as you have planned "clusters". Structure the elements of the "sub-clusters" according to your needs and link the sum to the corresponding fields on the first page.
Connect external (web) with your internal data by linking the corresponding fields with the data from the web.
Beyond 'kpisquare':
'kpisquare' is part of 'Business Engineering Systems' (Framework and metrics for smart economy).
'Business Engineering Systems' is part of 'INSEDE' (Institute for Sustainable Economic Development).
'INSEDE' is part of 'Project NEMO' (New/Next Economic Model).
Legal:
The representations are proprietary and part of the Business Engineering Systems (Registered Copyright TXu512154).
Private use is allowed without restriction and without license.
Creating derivative works and commercial use requires a registered license (end-user, consultant, education, software).
Questions/Feedback:
Questions about adapting the templates to your needs, licenses etc.. please send an email to
peter.bretscher@bengin.com
with the note "kpisquare".
Thank you for any comments about errors and for improvements.
Peter Bretscher, Engineering Office for Economic Development, Alpsteinstrasse 4, 9034 Eggersriet, Switzerland
Mobile: ++41 79 650 49 04
|
On this page you will find more and more examples. Just have a look again. |
|
|||||||||||||||||||||||||||||||||||||||||||||||||||||||||||||||||||||||||||||||||||||||||||||||||||||||||||||||||||
| (C) 2011/2020, Peter Bretscher,
peter.bretscher@bengin.com
- bengin.net -
insede.org Ingenieurburo fur Wirtschaftsentwicklung, Alpsteinstrasse 4, CH-9034 Eggersriet, Switzerland |
||||||||||||||||||||||||||||||||||||||||||||||||||||||||||||||||||||||||||||||||||||||||||||||||||||||||||||||||||||