
Institute for Sustainable
Economic Development
|
|
INSEDE Institute for Sustainable Economic Development |
|
Performance hat mehrere Dimensionen - der Performance Vektor macht diese
sichtbar.
Die Visualisierung der Werte mit dem Vektor ist Teil der "Business Engineering Systeme".
Sie enthalten eine strukturierte Sammlung von Instrumenten, mit denen die neue
Wirtschaft besser abgebildet und geplant werden kann.
Sie basieren auf den materiellen und immateriellen Ressourcen und erweitern den
klassischen Denkrahmen der Ökonomie so, dass es logisch ist, die vorhandenen
Ressourcen intelligent und nachhaltig so einzusetzen, dass echte Probleme von
Menschen gelöst werden können.
INSEDE (Institute for Sustainable Economic Development, ist ein startup project) ist die Basis für ein "open institute" das es Praktikern (nicht nur Akademikern) erlaubt, ihre Fähigkeiten für Problemlösungen laufend zu entwickeln und Lösungen zu teilen.
Auf dieser Einstiegsseite werden die Grundlagen für die Vektordarstellung
gezeigt.
Auf weiteren Seiten finden Sie dann Links zu Vorlagen und Beispiele für
verschiedene Anwendungen - als Browserversion und zum Downloaden als Excel 2010
Variante
Gemeinden
Unternehmensvergleich
Wofür ist ein Vektor gut?
"Mehr Informationen pro Pixel."
"Bessere, schnellere Einsichten in komplexe Zusammenhänge."
"Gemeinsames Verständnis und einfachere Kommunikation von
Erkenntnissen."
| Einfache Vektoren | |||||
 |
Links ist jetzt ein einfacher Vektor |
 |
Hier zwei Beispiele von Vektoren mit
"Hintergrund" Sie erlaubt es auch eher ungeübten Betrachtern schnell zu erkennen, welcher Geschäftsbereich..... eine bessere Performance aufweist. |
||
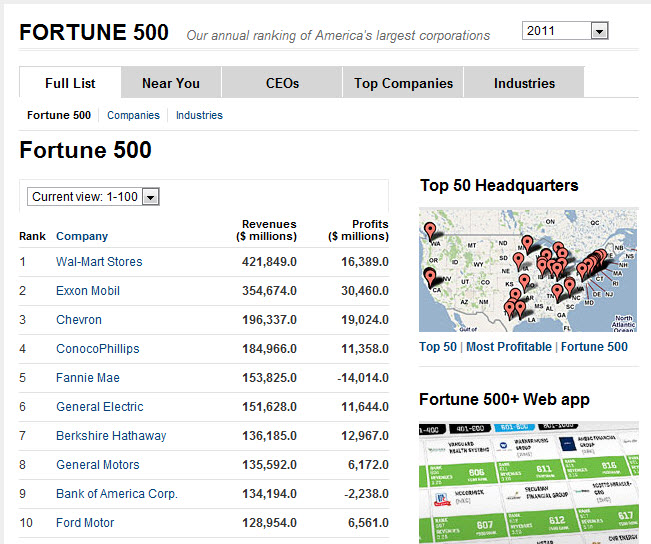

It is often not easy to see the interrelation between the numbers.
See the new Fortune 500 numbers (left picture)
Link to the original:
http://money.cnn.com/magazines/fortune/fortune500/2011/full_list/
Right you see our solution that introduces a vector as a 2d-value-metric
applied to the data of Fortune 500.
Colored boxes are for enterprises;
x-axis shows Revenues; y-axis shows Profits;
the vector then is the diagonal of the box and has its inclination depending on the
P/R-ratio;
inclination of red vector shows the average performance of the ten
companies.
Figure below is an interactive ExcelWebApp - based on Microsoft's SkyDrive -
that shows revenues and profit of some fortune500 companies. Four separate
sheets - for main list, computers, banks and energy. You may change the values
and see the impact on the performanceprofile.
You may use this template for your individual portfolio too.
As this vektor principle is very generic - and the two axis may have different units - it is possible to show the relation of any (even subjective) desired to any other indicator (be it monetary or non-monetary). From my point of view it may be that the vector may build the bridge between the financial and the non-financial "philosophy" that may lead to a more sustainable and integral value paradigm.
While using this beta ExcelWebApp you may experience some limitations.
If you have Excel 2010 you may download the file from here:
http://www.bengin.net/beta/10_fortune500_vii_v0.99_e.xlsx
Excel 2011 (2007 too) reduces the restrictions - but it's still "beta". :-)
If you intend to use this vector principle please keep in mind that it is part
of the "Business Engineering Systems" a proprietary set of tools; registered Copyright TXu 512 154, March 20, 1992;
Private use is free; no derivatives; commercial use (consulting, education....) needs individual license...
@ Google+:
https://plus.google.com/107048744275438760860/posts